Module Quiz: Modified
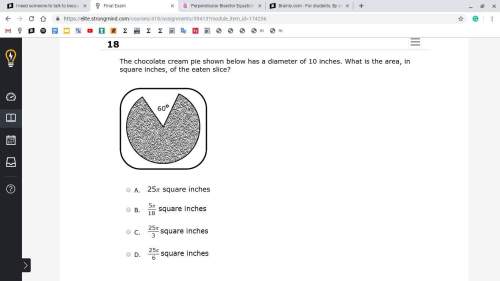
1. The table shows the results of a survey of
Mrs. Sus's students' favo...

Mathematics, 15.01.2021 02:30 jess2788
Module Quiz: Modified
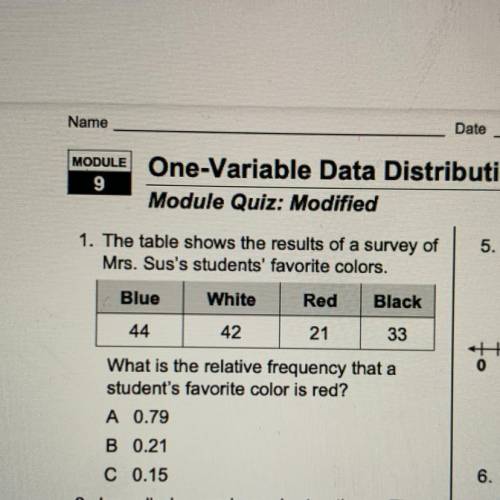
1. The table shows the results of a survey of
Mrs. Sus's students' favorite colors.
Blue
White
Red
Black
44
42
21
33
What is the relative frequency that a
student's favorite color is red?
A 0.79
B 0.21
C 0.15

Answers: 3


Other questions on the subject: Mathematics
Mathematics, 21.06.2019 15:30, williamnason123
Enter the missing numbers in the boxes to complete the table of equivalent ratios of lengths to widths. ? 18 8 ? 10 30 12 ?
Answers: 3
Mathematics, 21.06.2019 20:30, sterlingrobinson35
Someone answer asap for ! a ball is rolled down a ramp. the height, f(x), in meters, of the ball x seconds after it is released is modeled by the function f(x) = x²- 10x + 25 for all values of x from 0 to 5. which statement about the ball is true? a. the maximum height of the ball is 5 meters b. the height of the ball increases from 0 to 5 meters above the ground. c. the ball has traveled 5 meters when it reaches the bottom of the ramp. d. the ball has been traveling for 5 seconds when it reaches the bottom of the ramp
Answers: 1
Mathematics, 21.06.2019 22:10, carsondelane13
Monitors manufactured by tsi electronics have life spans that have a normal distribution with a standard deviation of 1800 hours and a mean life span of 20,000 hours. if a monitor is selected at random, find the probability that the life span of the monitor will be more than 17,659 hours. round your answer to four decimal places.
Answers: 2
Mathematics, 21.06.2019 23:00, maiacheerz
12 out of 30 people chose their favourite colour as blue caculate the angle you would use for blue on a pie chart
Answers: 1
You know the right answer?
Questions in other subjects:
Mathematics, 01.12.2021 21:00

Mathematics, 01.12.2021 21:00

Biology, 01.12.2021 21:00


