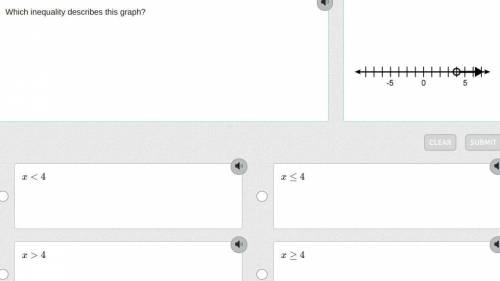
Which inequality describes this graph?
...

Mathematics, 14.01.2021 23:20 queenkimm26
Which inequality describes this graph?

Answers: 2


Other questions on the subject: Mathematics
Mathematics, 21.06.2019 23:30, honwismun1127
Which statements are true about box plots? check all that apply. they describe sets of data. they include the mean. they show the data split into four parts. they show outliers through really short “whiskers.” each section of a box plot represents 25% of the data.
Answers: 3
Mathematics, 22.06.2019 00:00, christeinberg1
An equation in slope-intersept form the lines that passes thought (-8,1) and is perpindicular to the y=2x-17.
Answers: 1
Mathematics, 22.06.2019 02:00, Kemosdasavage
What is solution for the following system of equations, 2x+8y=4 and x=-3y+5 1) x=14 y=-3 2) x=2 y=-3 3) x=-3 y=-3 4)x=12 y=5
Answers: 1
You know the right answer?
Questions in other subjects:

Social Studies, 07.07.2019 15:30

Biology, 07.07.2019 15:30

History, 07.07.2019 15:30

Mathematics, 07.07.2019 15:30

Biology, 07.07.2019 15:30


