
Mathematics, 14.01.2021 23:10 Worldprofessor6252
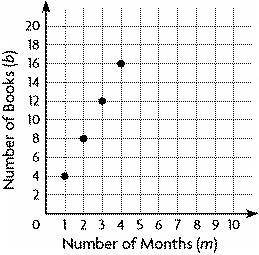
The graph shows the relationship between the number of months, m, and the number of books, b, Ivan has read.
Which list best represents the dependent values of the graphed points?
a
1, 2, 3, 4
b
4, 8, 12, 16
c
2, 4, 6, 8, 10, 12, 14, 16
d
1, 4, 2, 8, 3, 12, 4, 16

Answers: 1


Other questions on the subject: Mathematics
Mathematics, 21.06.2019 17:30, wwesuplexcity28
33% of college students say they use credit cards because of the rewards program. you randomly select 10 college students and ask each to name the reason he or she uses credit cards. find the probability that the number of college students who say they use credit cards because of the rewards program is (a) exactly two, (b) more than two, and (c) between two and five inclusive. if convenient, use technology to find the probabilities.
Answers: 1
Mathematics, 21.06.2019 20:00, cferguson
Someone answer asap for ! the total ticket sales for a high school basketball game were $2,260. the ticket price for students were $2.25 less than the adult ticket price. the number of adult tickets sold was 230, and the number of student tickets sold was 180. what was the price of an adult ticket?
Answers: 1
Mathematics, 21.06.2019 21:30, allendraven89pds755
Which equation is true? i. 56 ÷ 4·7 = 82 ÷ (11 + 5) ii. (24 ÷ 8 + 2)3 = (42 + 9)2 neither i nor ii ii only i and ii i only
Answers: 1
You know the right answer?
The graph shows the relationship between the number of months, m, and the number of books, b, Ivan h...
Questions in other subjects:


History, 19.11.2020 22:50

Computers and Technology, 19.11.2020 22:50


