
Mathematics, 14.01.2021 19:20 sayrieee
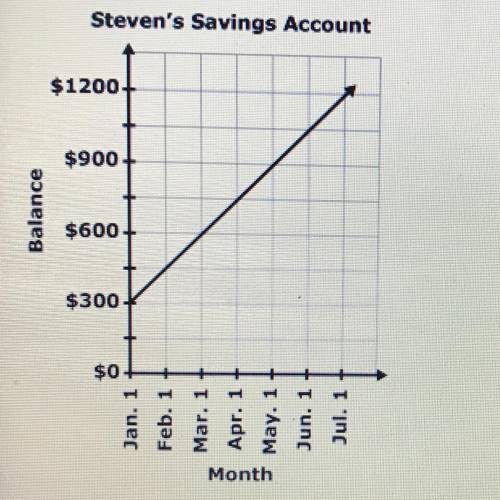
The graph below shows the balance in Steven's savings account as a function of time.
Steven's Savings Account
$ 1200
$900
Balance
$600
$300
$0
Jan. 17
Feb. 1
Mar. 1
Apr. 1 +
May. 1
Jun. 1
Jul. 1
Month
Based on the graph, which of the following statements is true about Steven's account balance?

Answers: 2


Other questions on the subject: Mathematics
Mathematics, 21.06.2019 20:00, triggernugget05
Afootball is throw by a quarterback to a receiver
Answers: 2
Mathematics, 21.06.2019 20:10, kingdrew27
Acolony contains 1500 bacteria. the population increases at a rate of 115% each hour. if x represents the number of hours elapsed, which function represents the scenario? f(x) = 1500(1.15)" f(x) = 1500(115) f(x) = 1500(2.15) f(x) = 1500(215)
Answers: 3
Mathematics, 21.06.2019 20:20, bbyjoker
Recall that the owner of a local health food store recently started a new ad campaign to attract more business and wants to know if average daily sales have increased. historically average daily sales were approximately $2,700. the upper bound of the 95% range of likely sample means for this one-sided test is approximately $2,843.44. if the owner took a random sample of forty-five days and found that daily average sales were now $2,984, what can she conclude at the 95% confidence level?
Answers: 1
You know the right answer?
The graph below shows the balance in Steven's savings account as a function of time.
Steven's Savin...
Questions in other subjects:

English, 27.12.2019 14:31


Mathematics, 27.12.2019 14:31

Physics, 27.12.2019 14:31

English, 27.12.2019 14:31

Geography, 27.12.2019 14:31
Physics, 27.12.2019 14:31


