
Mathematics, 14.01.2021 17:40 21tywmeb
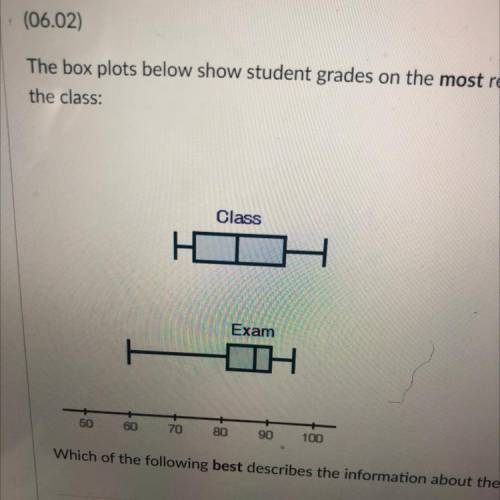
The box plot below shows student grades on the most recent exam compared to overall grades in the class ?
A. The exam outlier at 60 makes the IQR narrower and the median higher
B. The class data is more evenly spread which pulls its median down
C. The class median is lower than the exam median
D. The class Q3 is higher than the exam Q3

Answers: 2


Other questions on the subject: Mathematics
Mathematics, 20.06.2019 18:04, dpranavesh446
How do i do this using elimination 2x+3y=12 x-y=6
Answers: 2
Mathematics, 21.06.2019 14:50, sherry59Sherry59
What is the vertex form of f(x) = x2 + 6x + 3
Answers: 2
Mathematics, 21.06.2019 20:30, mariahcid904
Find the solution(s) to the system of equations. select all that apply y=x^2-1 y=2x-2
Answers: 2
You know the right answer?
The box plot below shows student grades on the most recent exam compared to overall grades in the cl...
Questions in other subjects:

Social Studies, 18.06.2021 16:20

Mathematics, 18.06.2021 16:20
Mathematics, 18.06.2021 16:20

Physics, 18.06.2021 16:20
Mathematics, 18.06.2021 16:20


