
Mathematics, 14.01.2021 14:00 ellycleland16
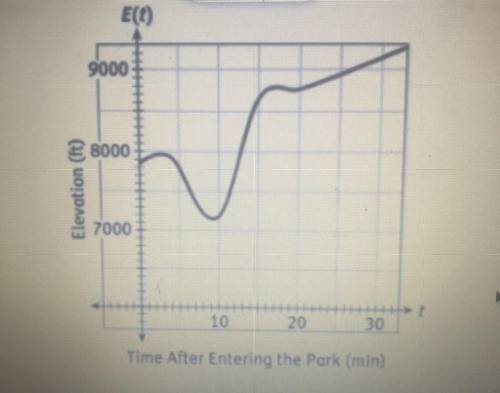
The graph represents a functionE(t). Describe why the graph represents a function. Identify the
domain and range of the function.
please help it’s very late

Answers: 3


Other questions on the subject: Mathematics
Mathematics, 21.06.2019 18:30, zovav1oszg9z
Analyze the graph of the cube root function shown on the right to determine the transformations of the parent function. then, determine the values of a, h, and k in the general equation.
Answers: 1
Mathematics, 22.06.2019 00:00, deidaraXneji
Table of values relation g values x, y 2,2 /3,5 /4,9 /5,13 which ordered pair is in g inverse? a(-2,2) b(-3,-5) c)4,9) d( 13,5)
Answers: 3
You know the right answer?
The graph represents a functionE(t). Describe why the graph represents a function. Identify the
dom...
Questions in other subjects:


