
Mathematics, 14.01.2021 09:20 AHSYEDAN
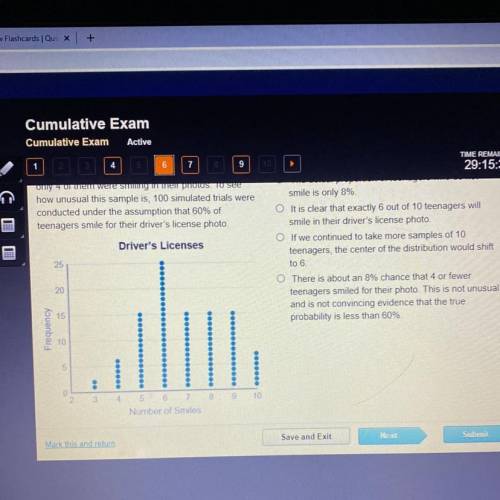
Based on the dotplot of the simulation results and the
random sample from last month's new driver's
licenses, which conclusion can be drawn?
A worker at the local Department of Motor Vehicles
(DMV) claims that 60% of teenagers smile in their
driver's license photo. In a random sample of 10
teenagers from last month's new driver's licenses,
only 4 of them were smiling in their photos. To see
how unusual this sample is, 100 simulated trials were
conducted under the assumption that 60% of
teenagers smile for their driver's license photo.
Driver's Licenses
O The actual proportion of teenagers who do not
smile is only 8%
O It is clear that exactly 6 out of 10 teenagers will
smile in their driver's license photo.
O If we continued to take more samples of 10
teenagers, the center of the distribution would shift
to 6
O There is about an 8% chance that 4 or fewer
teenagers smiled for their photo. This is not unusual
and is not convincing evidence that the true
probability is less than 60%.
25
20
15
Frequency
.
O
DO
Save and Exit
Next
Submit
Mark this and return

Answers: 3


Other questions on the subject: Mathematics
Mathematics, 21.06.2019 14:10, uhhgray
Students are given 3 minutes for each multiple-choice question and 5 minutes for each free-response question on a test. there are 15 questions on the test, and students are given 51 minutes to take it. how many multiple-choice questions are on the test?
Answers: 1
Mathematics, 22.06.2019 01:30, nickocasamplonp6mlob
Simplify 1/3 12x - 6 a. -2x-1 b.-2x-8 c.-x+4 d.3x+10 e. 4x-2
Answers: 1
You know the right answer?
Based on the dotplot of the simulation results and the
random sample from last month's new driver's...
Questions in other subjects:

Social Studies, 02.10.2021 14:00

Health, 02.10.2021 14:00

History, 02.10.2021 14:00


SAT, 02.10.2021 14:10
Mathematics, 02.10.2021 14:10


