
Mathematics, 14.01.2021 03:00 elizavlsc4
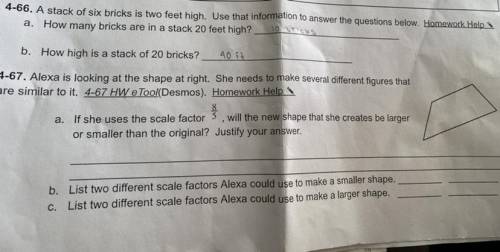
Alexa is looking at the shape at right she needs to make several different figures that are similar to it... (I need help with a-c)

Answers: 3


Other questions on the subject: Mathematics
Mathematics, 21.06.2019 13:10, acrooks86
Write a numerical expression that satisfies all of the following conditions. 1.)the only number used in the expression is 5 2.)at least one exponent other than 1 is used 3.)when the expression is evaluated, the answer is greater than 40 and less than 50
Answers: 3
Mathematics, 21.06.2019 14:30, kawaiiiiiiii4715
The circumference of a circle is 5 pi cm. what is the area of the circle?
Answers: 2
Mathematics, 21.06.2019 15:00, AJSkullcrusher
This week, conrad will work 1 3/4 times longer than last week. giovanni will work 1 1/3 times longer than last week. sally will work 2/3 the number of hours she worked last week. match each employee's name to the number of hours he or she will work this week
Answers: 1
Mathematics, 21.06.2019 16:00, kell22wolf
Part one: measurements 1. measure your own height and arm span (from finger-tip to finger-tip) in inches. you will likely need some from a parent, guardian, or sibling to get accurate measurements. record your measurements on the "data record" document. use the "data record" to you complete part two of this project. name relationship to student x height in inches y arm span in inches archie dad 72 72 ginelle mom 65 66 sarah sister 64 65 meleah sister 66 3/4 67 rachel sister 53 1/2 53 emily auntie 66 1/2 66 hannah myself 66 1/2 69 part two: representation of data with plots 1. using graphing software of your choice, create a scatter plot of your data. predict the line of best fit, and sketch it on your graph. part three: the line of best fit include your scatter plot and the answers to the following questions in your word processing document 1. 1. which variable did you plot on the x-axis, and which variable did you plot on the y-axis? explain why you assigned the variables in that way. 2. write the equation of the line of best fit using the slope-intercept formula $y = mx + b$. show all your work, including the points used to determine the slope and how the equation was determined. 3. what does the slope of the line represent within the context of your graph? what does the y-intercept represent? 5. use the line of best fit to you to describe the data correlation.
Answers: 2
You know the right answer?
Alexa is looking at the shape at right she needs to make several different figures that are similar...
Questions in other subjects:
Engineering, 15.04.2020 00:12
Mathematics, 15.04.2020 00:12

Mathematics, 15.04.2020 00:12

Mathematics, 15.04.2020 00:12


