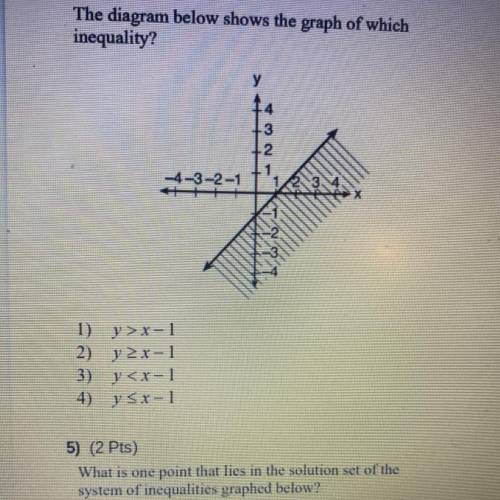
The diagram below shows the graph of which
inequality?
у
4
3
2
1-3-2-...

Mathematics, 13.01.2021 23:40 xrivas
The diagram below shows the graph of which
inequality?
у
4
3
2
1-3-2-1
1) y > x-1
2) y 2r-1
3) y
4) SX-1


Answers: 3


Other questions on the subject: Mathematics

Mathematics, 21.06.2019 20:00, guccim5971
Suppose you are an avid reader and are looking to save money on the cost of books instead of paying about $20 for each book, you decide to look into purchasing a kindle for $120 you can purchase e-books for about $5 each 1. find the slope-intercept equation for the cost of the hard copy of books using x to represent the number of books 2. find the slope-intercept equation for the cost of the kindle with cost of e-books using x to represent the number of books
Answers: 1


Mathematics, 21.06.2019 22:30, Calmalemi
Marquise has 200 meters of fencing to build a rectangular garden. the garden's area (in square meters) as a function of the garden's width w w (in meters) is modeled by: a ( w ) = − w 2 + 1 0 0 w a(w)=−w 2 +100w what side width will produce the maximum garden area? meters
Answers: 1
You know the right answer?
Questions in other subjects:


Geography, 23.07.2019 06:30


Geography, 23.07.2019 06:30

English, 23.07.2019 06:30

Geography, 23.07.2019 06:30

History, 23.07.2019 06:30


