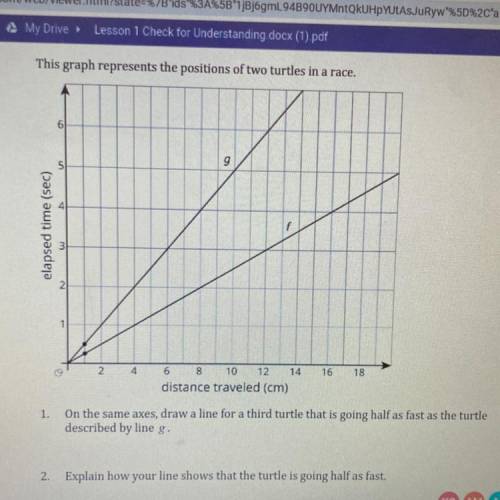
This graph represents the positions of two turtles in a race.
9
5
elapsed time (sec)
3
2
2
18
4
16
6 8 10 12 14
distance traveled (cm)
1. On the same axes, draw a line for a third turtle that is going half as fast as the turtle
described by line g.
2.
Explain how your line shows that the turtle is going half as fast.
Colby and jaquan are growing bacteria in an experiment in a laboratory. colby starts with 50 bacteria in his culture and the number of bacteria doubles every 2 hours. jaquan starts with 80 of a different type of bacteria that doubles every 3 hours. let x equal number of days. colbys experiment follows the model: a.) y=50*2^x b.) y=50*2^8x c.) y=50*2^12x jaquans experiment follows the model: a.)80*2^x b.)80*2^8x c.)80*2^12x
An investment decreases in value by 30% in the first year and decreases by 40% in the second year. what is the percent decrease in percentage in the investment after two years