Identify the range of the function shown in the graph.
10
8
-10
A. 0 < y<3<...

Mathematics, 13.01.2021 21:00 deadpoolcorvettehats
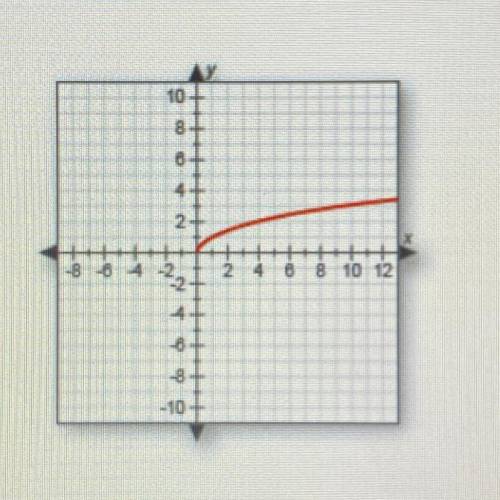
Identify the range of the function shown in the graph.
10
8
-10
A. 0 < y<3
O B. y< 0
O c. y is all real numbers.
O D. 720

Answers: 2


Other questions on the subject: Mathematics
Mathematics, 21.06.2019 18:00, cashhd1212
The given dot plot represents the average daily temperatures, in degrees fahrenheit, recorded in a town during the first 15 days of september. if the dot plot is converted to a box plot, the first quartile would be drawn at __ , and the third quartile would be drawn at __ link to graph: .
Answers: 1
You know the right answer?
Questions in other subjects:
Mathematics, 10.03.2021 20:10


History, 10.03.2021 20:10
Mathematics, 10.03.2021 20:10
Mathematics, 10.03.2021 20:10

English, 10.03.2021 20:10
Mathematics, 10.03.2021 20:10
Mathematics, 10.03.2021 20:10


