
Mathematics, 12.01.2021 23:20 pascente5
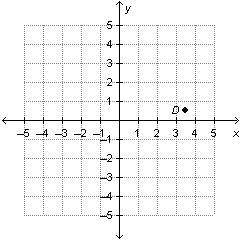
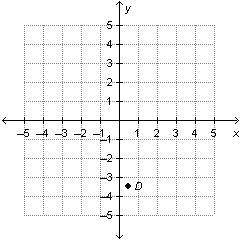
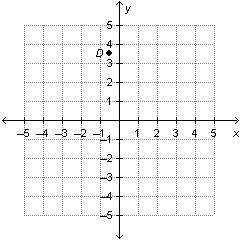
Opal plots point D at (Negative 3 and one-half, one-half). Which graph shows the location of point D?
A.
B.
C.
D.


Answers: 2


Other questions on the subject: Mathematics
Mathematics, 21.06.2019 19:00, PastelHibiscus
Which equation represents the function on the graph?
Answers: 1
Mathematics, 21.06.2019 23:00, jalenrussell321
The height of a birch tree, f(x), in inches, after x months is shown in the graph below. how much does the birch tree grow per month, and what will be the height of the birch tree after 10 months? a. the birch tree grows 1 inch per month. the height of the birch tree will be 16 inches after 10 months. b. the birch tree grows 2 inches per month. the height of the birch tree will be 26 inches after 10 months. c. the birch tree grows 3 inches per month. the height of the birch tree will be 36 inches after 10 months. d. the birch tree grows 2 inches per month. the height of the birch tree will be 24 inches after 10 months.
Answers: 1
Mathematics, 22.06.2019 00:30, hhvgbv7147
A)a square brown tarp has a square green patch green in the corner the side length of the tarp is (x + 8) and the side length of the patch is x what is the area of the brown part of the tarpb)a square red placemat has a gold square in the corner the side length of the gold square is (x - 2) inches with the width of the red region is 4 in what is the area of the red part of the placemat
Answers: 2
You know the right answer?
Opal plots point D at (Negative 3 and one-half, one-half). Which graph shows the location of point D...
Questions in other subjects:

Mathematics, 22.07.2019 05:40

History, 22.07.2019 05:40

Mathematics, 22.07.2019 05:40
Mathematics, 22.07.2019 05:40


