
Mathematics, 12.01.2021 22:00 ericadawn2852
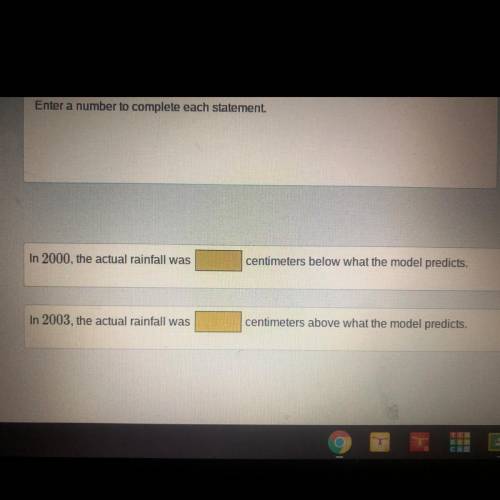
The scatter plot shows a correlation between the years and the rainfall in centimeters
in Tennessee.
The line of regression models that correlation.
Enter a number to complete each statement.

Answers: 1


Other questions on the subject: Mathematics
Mathematics, 21.06.2019 18:00, xojade
Assume that the weights of quarters are normally distributed with a mean of 5.67 g and a standard deviation 0.070 g. a vending machine will only accept coins weighing between 5.48 g and 5.82 g. what percentage of legal quarters will be rejected? round your answer to two decimal places.
Answers: 1
Mathematics, 21.06.2019 19:30, shanua
Needmax recorded the heights of 500 male humans. he found that the heights were normally distributed around a mean of 177 centimeters. which statements about max’s data must be true? a) the median of max’s data is 250 b) more than half of the data points max recorded were 177 centimeters. c) a data point chosen at random is as likely to be above the mean as it is to be below the mean. d) every height within three standard deviations of the mean is equally likely to be chosen if a data point is selected at random.
Answers: 2
Mathematics, 21.06.2019 21:00, kharmaculpepper
Joanie watched 1 out of three of a movie in the morning
Answers: 1
Mathematics, 21.06.2019 21:30, fara26
*let m∠cob = 50°30’, m∠aob = 70° and m∠aoc = 20°30’. could point c be in the interior of ∠aob? why? a. point c could be the interior of aob but it is not the only case b. point c is the interior of aob c. point c is not the interior of aob d. the given is not possible for the plane geometry answer
Answers: 1
You know the right answer?
The scatter plot shows a correlation between the years and the rainfall in centimeters
in Tennessee...
Questions in other subjects:

History, 15.12.2021 04:30


Physics, 15.12.2021 04:30
Mathematics, 15.12.2021 04:30

English, 15.12.2021 04:30


