Which graph best represents a logarithmic function?
...

Mathematics, 12.01.2021 19:30 bayloann2621
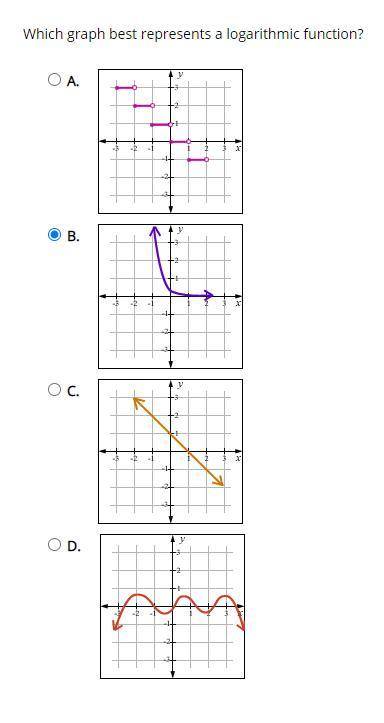
Which graph best represents a logarithmic function?

Answers: 2


Other questions on the subject: Mathematics
Mathematics, 20.06.2019 18:02, zarrialamons16
Given a circle with a radius of 2 which is the length of an arc measuring 75
Answers: 3
Mathematics, 21.06.2019 21:00, 22MadisonT
Abakery recorded the number of muffins and bagels it sold for a seven day period. for the data presented, what does the value of 51 summarize? a) mean of bagels b) mean of muffins c) range of bagels d) range of muffins sample # 1 2 3 4 5 6 7 muffins 61 20 32 58 62 61 56 bagels 34 45 43 42 46 72 75
Answers: 2
You know the right answer?
Questions in other subjects:
Mathematics, 21.08.2020 08:01

Computers and Technology, 21.08.2020 08:01

Mathematics, 21.08.2020 08:01

Mathematics, 21.08.2020 08:01
Mathematics, 21.08.2020 08:01
Mathematics, 21.08.2020 08:01


