
Mathematics, 12.01.2021 14:40 Callmetay24
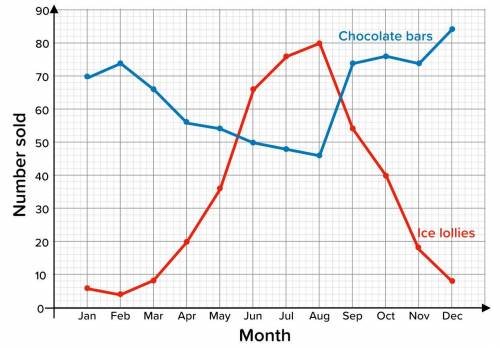
The line graph below shows the number of chocolate bars and ice lollies sold at a small shop over a year.
Pick the month below in which more ice lollies were sold than chocolate bars.
January
July
April
May

Answers: 2


Other questions on the subject: Mathematics
Mathematics, 21.06.2019 19:00, haileysolis5
Arestaurant chef made 1 1/2 jars of pasta sauce. each serving of pasta requires 1/2 of a jar of sauce. how many servings of pasta will the chef be bale to prepare using the sauce?
Answers: 3
Mathematics, 21.06.2019 22:00, shelovejaylocs
The median am of triangle ∆abc is half the length of the side towards which it is drawn, bc . prove that triangle ∆abc is a right triangle, and find angle mac and abm
Answers: 1
You know the right answer?
The line graph below shows the number of chocolate bars and ice lollies sold at a small shop over a...
Questions in other subjects:


History, 08.12.2020 01:00
Mathematics, 08.12.2020 01:00
Mathematics, 08.12.2020 01:00
Biology, 08.12.2020 01:00


