
Mathematics, 12.01.2021 02:00 princeton23124
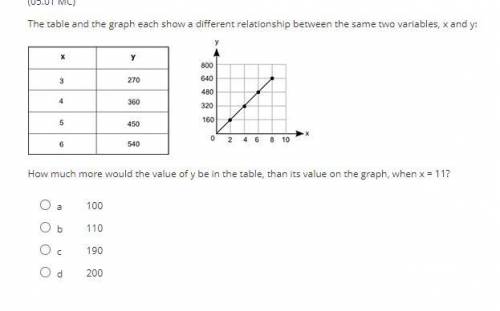
The table and the graph each show a different relationship between the same two variables, x, and y:
A table with two columns and 5 rows is shown. The column head for the left column is x, and the column head for the right column is y. The row entries in the table are 3,270 and 4,360 and 5,450 and 6,540. On the right of this table is a graph. The x-axis values are from 0 to 10 in increments of 2 for each grid line. The y-axis values on the graph are from 0 to 800 in increments of 160 for each grid line. A line passing through the ordered pairs 2, 160 and 4, 320 and 6, 480 and 8, 640 is drawn.
How much more would the value of y be in the table, than its value on the graph, when x = 11?
a
100
b
110
c
190
d
200

Answers: 1


Other questions on the subject: Mathematics
Mathematics, 21.06.2019 17:30, wwesuplexcity28
33% of college students say they use credit cards because of the rewards program. you randomly select 10 college students and ask each to name the reason he or she uses credit cards. find the probability that the number of college students who say they use credit cards because of the rewards program is (a) exactly two, (b) more than two, and (c) between two and five inclusive. if convenient, use technology to find the probabilities.
Answers: 1
Mathematics, 21.06.2019 21:30, celeste961
Write 5(6x+4)-2(5x-2) in the form a(bx+c) where a, b and c integers and a> 1
Answers: 2
Mathematics, 21.06.2019 22:00, 1xXJOKERXx3
Rewrite 9 log, x2 in a form that does not use exponents. 9log, x = log, x
Answers: 3
You know the right answer?
The table and the graph each show a different relationship between the same two variables, x, and y:...
Questions in other subjects:
Mathematics, 19.05.2020 18:04

Spanish, 19.05.2020 18:04

Social Studies, 19.05.2020 18:04
Mathematics, 19.05.2020 18:04


English, 19.05.2020 18:05


