2. (05.06)
The graph below represents which system of inequalities? (2 points)
A. y <...

Mathematics, 11.01.2021 22:20 fallenangelsayshush
2. (05.06)
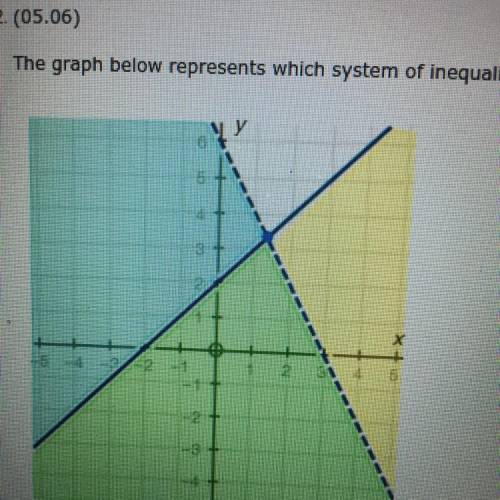
The graph below represents which system of inequalities? (2 points)
A. y < -2 + 6
y ≤ x + 2
B. y ≤ x + 2 + 6
y < x + 2
C. y < 2 over 3 x - 2
y ≥ 2x + 2
D. None of the above

Answers: 1


Other questions on the subject: Mathematics
Mathematics, 21.06.2019 17:00, KHaire2077
In a sample of 2023 u. s. adults, 373 said franklin roosevelt was the best president since world war ii. two u. s. adults are selected at random from the population of all u. s. adults without replacement. assuming the sample is representative of all u. s. adults, complete parts (a) through (d). (a) find the probability that both adults say franklin roosevelt was the best president since world war ii. the probability that both adults say franklin roosevelt was the best president since world war ii is (round to three decimal places as needed.) (b) find the probability that neither adult says franklin roosevelt was the best president since world war ii. the probability that neither adult says franklin roosevelt was the best president since world war ii is (round to three decimal places as needed.) (c) find the probability that at least one of the two adults says franklin roosevelt was the best president since world war ii. the probability that at least one of the two adults says franklin roosevelt was the best president since world war ii is (round to three decimal places as needed.) (d) which of the events can be considered unusual? explain. select all that apply. the event in part left parenthesis a right parenthesis is unusual because its probability is less than or equal to 0.05. the event in part (b) is unusual because its probability is less than or equal to 0.05. none of these events are unusual. the event in part (c) is unusual because its probability is less than or equal to 0.05.
Answers: 3
Mathematics, 21.06.2019 18:30, 2024daisjavien
For this option, you will work individually. the pythagorean theorem can be used in many real-world scenarios. part 1 write your own real-world scenario where the pythagorean theorem can be applied to find a missing piece. you may choose to write a problem that is two- or three-dimensional in nature. be sure that you will be able to draw a diagram of your scenario. write out your problem and submit it for part 1. be sure to end your scenario with a question. part 2 draw a diagram of the scenario you created in part 1. you may draw by hand and scan and upload your drawing or create a computer-generated drawing for submission. be sure to label all parts and dimensions of the drawing. part 3 solve the question that you posed in part 1. show all of your steps in answering the question. for this option, you will need to submit all three parts for full credit—your real-world problem and question, the diagram that you created, and your work solving the problem, showing all steps. * note that your instructor is looking for your own original idea. while it is acceptable to use the internet for research and inspiration, academic integrity policies apply.
Answers: 1
Mathematics, 22.06.2019 00:50, katlyn10289
Margie is practicing for an upcoming tennis tournament. her first serve is good 20 out of 30 times on average. margie wants to know the estimated probability that her first serve will be good at least four of the next six times she serves. how could she design a simulation for this scenario?
Answers: 3
Mathematics, 22.06.2019 01:30, bethanybowers4986
Jahdzia wears her winter coat when the temperature is colder than -4 degrees celsius. write an inequality that is true only for temperatures (t) at which jahdzia wears her winter coat.
Answers: 3
You know the right answer?
Questions in other subjects:


Biology, 02.09.2020 18:01
Mathematics, 02.09.2020 18:01


