
Mathematics, 12.10.2019 21:10 rylee87
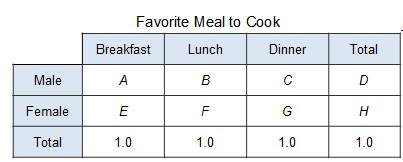
The conditional relative frequency table below was generated by column using data comparing gender and a person's favorite meal to cook.
which would most likely indicate an association between the categorical variables?
a: the value of a is similar to the value of b.
b: the value of a is similar to the value of e.
c: the value of b is not similar to the value of c.
d: the value of b is not similar to the value of f.

Answers: 1


Other questions on the subject: Mathematics
Mathematics, 21.06.2019 17:00, KendallTishie724
In the given figure ar(adf) =ar(cda) and ar(cdf) = ar(cdf). show that abdc and cdfe are trapeziums.
Answers: 2
Mathematics, 21.06.2019 17:30, BreBreDoeCCx
If the class was going to get a class pet and 5 picked fish and 7 pick bird and 8 picked rabbits have many students were in the
Answers: 1
You know the right answer?
The conditional relative frequency table below was generated by column using data comparing gender a...
Questions in other subjects:


Mathematics, 17.03.2020 04:19
Mathematics, 17.03.2020 04:19


