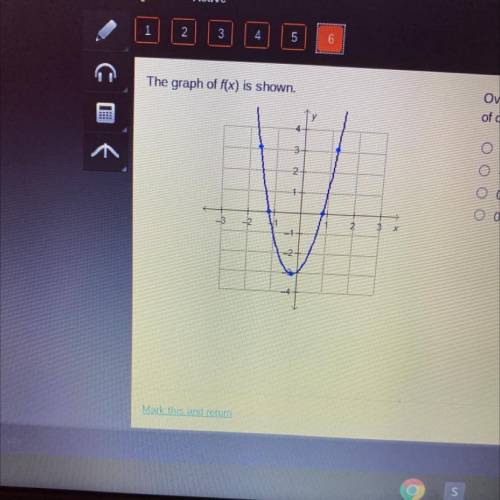
The graph of f(x) is shown.
Over which interval on the x-axis is there a negative rate
of cha...

Mathematics, 09.01.2021 03:10 hajoshh
The graph of f(x) is shown.
Over which interval on the x-axis is there a negative rate
of change in the function?
O-2 to -1
O -1.5 to 0.5
O O to 1
O 0.5 to 1.5

Answers: 3


Other questions on the subject: Mathematics
Mathematics, 21.06.2019 15:30, juliopejfuhrf5447
What number should be added to both sides of the equation to complete this square? x^2-10x=7
Answers: 3
You know the right answer?
Questions in other subjects:

History, 22.10.2020 06:01
Mathematics, 22.10.2020 06:01


Biology, 22.10.2020 06:01

Spanish, 22.10.2020 06:01


