
Mathematics, 08.01.2021 21:40 xaxtusgod
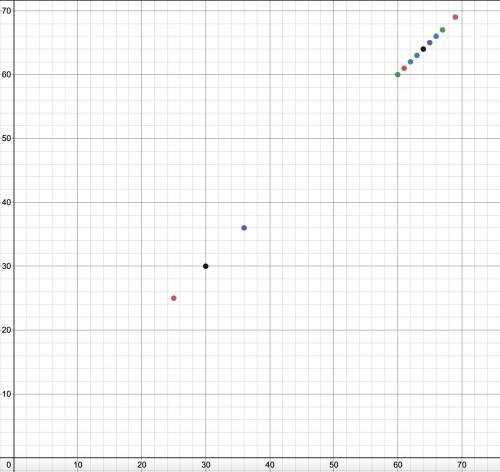
1. Which variable did you plot on the x-axis, and which variable did you plot on the y-axis? Explain why you assigned the variables in that way.
2. Write the equation of the line of best fit using the slope-intercept formula $y = mx + b$. Show all your work, including the points used to determine the slope and how the equation was determined.
3. What does the slope of the line represent within the context of your graph? What does the y-intercept represent?
4. Test the residuals of two other points to determine how well the line of best fit models the data.
I've included a picture of my graph down below I just really need number 1 and 2 at the moment but any question answered through 1 and 4 would we very appreciated :) thank you very much :D I will be reporting answers that aren't correct, silly, or unhelpful because I just really need these answers and it only allows up to 2 people to answer.

Answers: 3


Other questions on the subject: Mathematics
Mathematics, 21.06.2019 15:30, 24lfoster
According to statistics a person will devote 32 years to sleeping and watching tv. the number of years sleeping will exceed the number of years watching tv by 18. over a lifetime, how many years will the person spend on each of these activities
Answers: 1
Mathematics, 21.06.2019 17:00, ninjapig647
Write numerical coefficient of y² in the expression 2x² - 15xy – 7y²
Answers: 1
Mathematics, 21.06.2019 17:30, milkshakegrande101
Which of the following tables represents exponential functions?
Answers: 1
You know the right answer?
1. Which variable did you plot on the x-axis, and which variable did you plot on the y-axis? Explain...
Questions in other subjects:


History, 09.12.2021 22:30
Mathematics, 09.12.2021 22:30

Chemistry, 09.12.2021 22:30


