PLEASE ANSWER CORRECTLY! ALSO PLEASE ANSWER ALL (A B C D)
STEP 3
You and your business partne...

Mathematics, 08.01.2021 01:00 lerasteidl
PLEASE ANSWER CORRECTLY! ALSO PLEASE ANSWER ALL (A B C D)
STEP 3
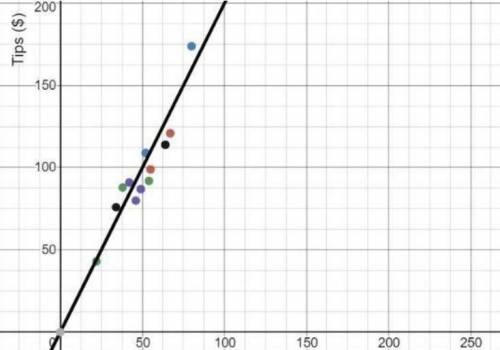
You and your business partner track the number of customers served and the amount of tips collected per day. The data you gathered is displayed in the chart below.
Servers’ Collected Tips
Customers 54 46 34 67 52 22 49 64 55 80 38 42
Tips ($) $92 $80 $76 $121 $109 $43 $87 $114 $99 $174 $88 $91
a) Create a scatterplot displaying the data in the table. Be sure to include a linear trend line.
b) Find the equation of the trend line (line of best fit). Show your work.
c) Predict the amount of tips that would be collected if 100 customers were served at the restaurant on a given day. Explain your reasoning.
d) Explain how to use the regression calculator to make a reasonable prediction given a data table.

Answers: 1


Other questions on the subject: Mathematics
Mathematics, 21.06.2019 19:30, auviannadority13
Equation for the calculation double 2 and then add 5
Answers: 1
Mathematics, 21.06.2019 23:00, kayvontay4
The coordinate grid shows a pentagon. the pentagon is translated 3 units to the right and 5 units up to create a new pentagon. what is the rule for the location of the new pentagon?
Answers: 3
Mathematics, 22.06.2019 01:30, damienlopezram
Five friends found a dollar on the ground and decided they each should get 1/5 of it. what amount of money will each friend get? $0.05 $0.20 $0.30 $0.80
Answers: 2
You know the right answer?
Questions in other subjects:


Mathematics, 10.12.2019 01:31


