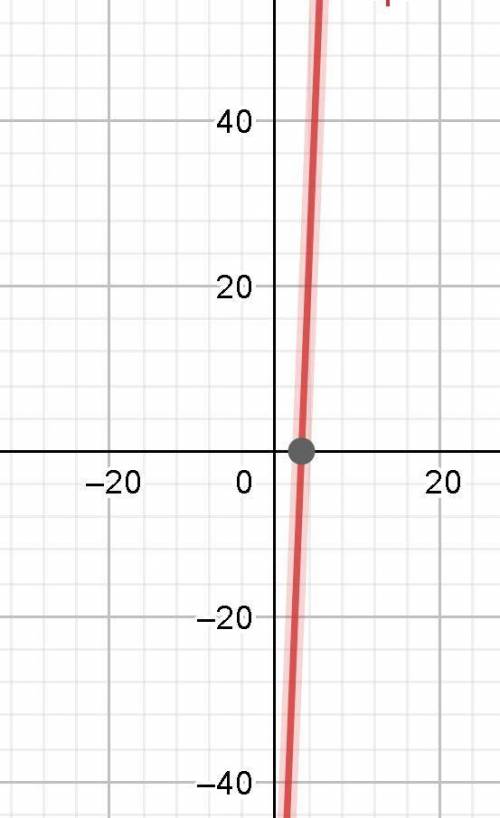
Graph the linear equation.
y+4=25(x−3)...

Mathematics, 08.01.2021 01:00 travyse
Graph the linear equation.
y+4=25(x−3)

Answers: 2


Other questions on the subject: Mathematics
Mathematics, 21.06.2019 19:30, jasminetaylor4587
According to the data set, where should the upper quartile line of the box plot be placed?
Answers: 1
Mathematics, 21.06.2019 20:00, gordon57
Someone answer asap for ! max recorded the heights of 500 male humans. he found that the heights were normally distributed around a mean of 177 centimeters. which statements about max’s data must be true? a. the median of max’s data is 250 b. more than half of the data points max recorded were 177 centimeters. c. a data point chosen at random is as likely to be above the mean as it is to be below the mean. d. every height within three standard deviations of the mean is equally likely to be chosen if a data point is selected at random.
Answers: 1
You know the right answer?
Questions in other subjects:
Mathematics, 29.01.2021 21:00

History, 29.01.2021 21:00


Biology, 29.01.2021 21:00

Mathematics, 29.01.2021 21:00
Mathematics, 29.01.2021 21:00


