
Mathematics, 07.01.2021 23:20 quan1541
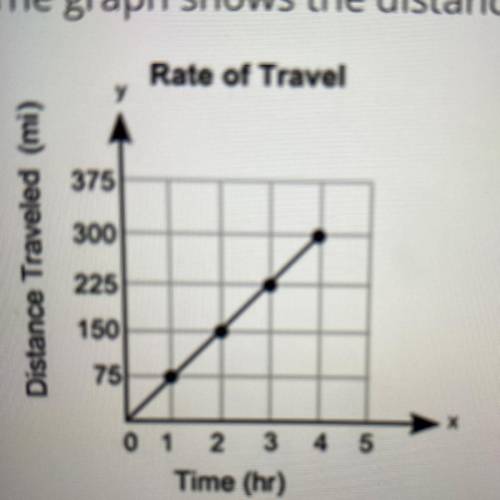
The graph shows the distance, y, that a car traveled in x hours: What is the rate of change for the relationship represented in the graph? A. 1/150. B. 1/75. C. 75. D. 150 Please help fast

Answers: 2


Other questions on the subject: Mathematics
Mathematics, 21.06.2019 21:30, drepeter86
50 people men and women were asked if they watched at least one sport on tv. 20 of the people surveyed are women, but only 9 of them watch at least one sport on tv. 16 of the men watch at least one sport on tv. make a a two-way table and a relative frequency table to represent the data.
Answers: 3
Mathematics, 21.06.2019 22:20, jimena15
As voters exit the polls, you ask a representative random sample of voters if they voted for a proposition. if the true percentage of voters who vote for the proposition is 63%, what is the probability that, in your sample, exactly 5 do not voted for the proposition before 2 voted for the proposition? the probability is
Answers: 2
You know the right answer?
The graph shows the distance, y, that a car traveled in x hours: What is the rate of change for the...
Questions in other subjects:


Mathematics, 01.08.2019 12:00


