
Mathematics, 07.01.2021 21:30 idioticeinstein9021
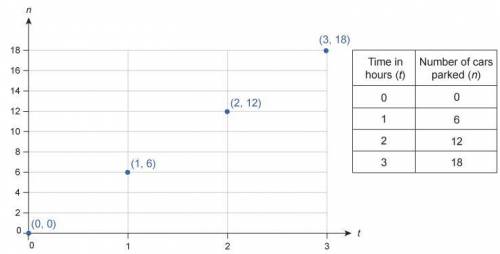
This graph and table show the total number of cars parked in a parking lot, n, after it was open for t hours.
Plot and table. Plot has horizontal axis from 0 to 3 in increments of 1, labeled t, and vertical axis from 0 to 18 in increments of 2, labeled n. Plot shows the points left parenthesis 0 comma 0 right parenthesis, left parenthesis 1 comma 6 right parenthesis, left parenthesis 2 comma 12 right parenthesis, and left parenthesis 3 comma 18 right parenthesis. Two-column table has column Time in hours left parenthesis t right parenthesis showing values 0, 1, 2, 3 and column Number of cars parked left parenthesis n right parenthesis showing values 0, 6, 12, 18.
What is an equation showing the relationship between n and t?
Enter your answer by filling in the box to complete the equation.
n =

Answers: 1


Other questions on the subject: Mathematics
Mathematics, 21.06.2019 21:30, camosloppy3150
Aboard 60 in. long is cut two parts so that the longer piece is 5 times the shorter. what are the length of the two pieces?
Answers: 1
Mathematics, 21.06.2019 22:00, fatherbamboo
Worth 100 points need the answers asap first row -x^2 2x^2 (x/2)^2 x^2 x is less than 2 x is greater than 2 x is less than or equal to 2 x is greater than or equal to 2 second row -5 -5/2 4 5 •2 is less than x& x is less than 4 •2 is less than or equal to x & x is less than or equal to 4 •2 is less than or equal to x& x is less than 4 •2 is less than x& x is less than or equal to 4
Answers: 2
You know the right answer?
This graph and table show the total number of cars parked in a parking lot, n, after it was open for...
Questions in other subjects:


History, 28.06.2019 15:00
English, 28.06.2019 15:00
History, 28.06.2019 15:00

Physics, 28.06.2019 15:00


