
Mathematics, 06.01.2021 23:20 lindamillscotton90
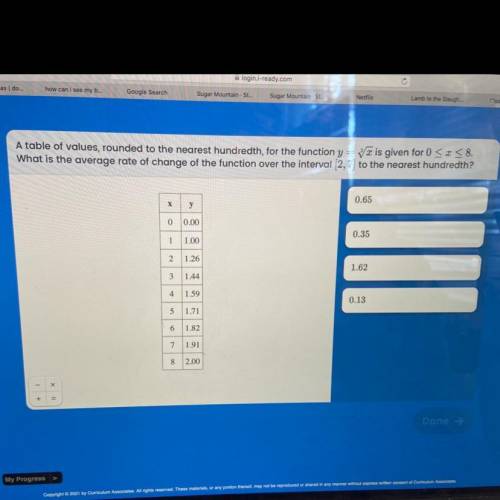
A table of values, rounded to the nearest hundredth, for the function y = ya is given for 0 < x < 8. What is the average rate of change of the function over the interval (2, 7) to the nearest hundredth?

Answers: 1


Other questions on the subject: Mathematics
Mathematics, 21.06.2019 22:30, carltonwashington23
Julie was able to walk 16 km through the zoo in 6 hours. how long will it take her to walk 24 km through the zoo?
Answers: 2
Mathematics, 21.06.2019 23:30, 20lap01
(c) compare the results of parts (a) and (b). in general, how do you think the mode, median, and mean are affected when each data value in a set is multiplied by the same constant? multiplying each data value by the same constant c results in the mode, median, and mean increasing by a factor of c. multiplying each data value by the same constant c results in the mode, median, and mean remaining the same. multiplying each data value by the same constant c results in the mode, median, and mean decreasing by a factor of c. there is no distinct pattern when each data value is multiplied by the same constant. (d) suppose you have information about average heights of a random sample of airline passengers. the mode is 65 inches, the median is 72 inches, and the mean is 65 inches. to convert the data into centimeters, multiply each data value by 2.54. what are the values of the mode, median, and mean in centimeters? (enter your answers to two decimal places.) mode cm median cm mean cm in this problem, we explore the effect on the mean, median, and mode of multiplying each data value by the same number. consider the following data set 7, 7, 8, 11, 15. (a) compute the mode, median, and mean. (enter your answers to one (1) decimal places.) mean value = median = mode = (b) multiply 3 to each of the data values. compute the mode, median, and mean. (enter your answers to one (1) decimal places.) mean value = median = mode = --
Answers: 1
Mathematics, 22.06.2019 00:30, kitykay2399
An unknown number x is at most 10. which graph best represents all the values of x? number line graph with closed circle on 10 and shading to the right. number line graph with open circle on 10 and shading to the right. number line graph with open circle on 10 and shading to the left. number line graph with closed circle on 10 and shading to the left.
Answers: 1
You know the right answer?
A table of values, rounded to the nearest hundredth, for the function y = ya is given for 0 < x &...
Questions in other subjects:
Mathematics, 10.10.2019 05:00

English, 10.10.2019 05:00
Mathematics, 10.10.2019 05:00
Mathematics, 10.10.2019 05:00


History, 10.10.2019 05:00
English, 10.10.2019 05:00


