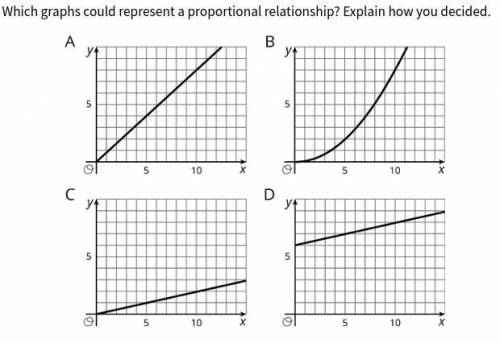
Which graphs could represent a proportional relationship? Explain how you decided.
...

Mathematics, 06.01.2021 20:50 luis9527
Which graphs could represent a proportional relationship? Explain how you decided.

Answers: 1


Other questions on the subject: Mathematics
Mathematics, 21.06.2019 16:10, lilyplant4289
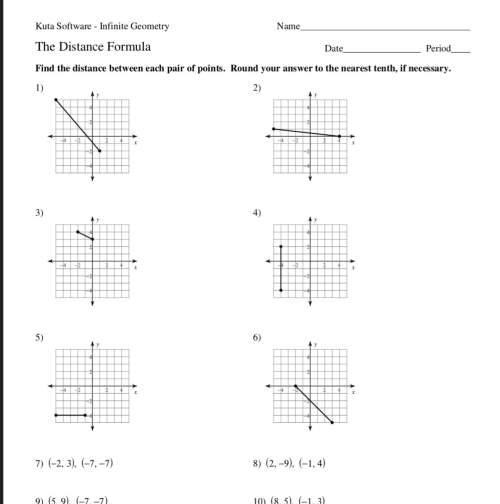
The number of hours per week that the television is turned on is determined for each family in a sample. the mean of the data is 37 hours and the median is 33.2 hours. twenty-four of the families in the sample turned on the television for 22 hours or less for the week. the 13th percentile of the data is 22 hours. approximately how many families are in the sample? round your answer to the nearest integer.
Answers: 1
Mathematics, 21.06.2019 19:00, AbhiramAkella
You earn a 12% commission for every car you sell. how much is your commission if you sell a $23,000 car?
Answers: 1
Mathematics, 21.06.2019 23:40, kamdenburr
Sanjay solved the equation below. which property did he use to determine that 7x+42=42 is equivalent to 7(x+6)=42 7x+42=42 7x=0 x=0
Answers: 1
Mathematics, 22.06.2019 00:30, naynay4evr
Describe how to translate the graph of y=/x to obtain the graph of y=/x+5
Answers: 2
You know the right answer?
Questions in other subjects:

Mathematics, 26.09.2021 23:40
Mathematics, 26.09.2021 23:40

Mathematics, 26.09.2021 23:40
Mathematics, 26.09.2021 23:40

Mathematics, 26.09.2021 23:40


