Question
The data plot shown represents the age of the members of a jogging club.
Х Х
Х...

Mathematics, 06.01.2021 02:10 serenityjohnson98765
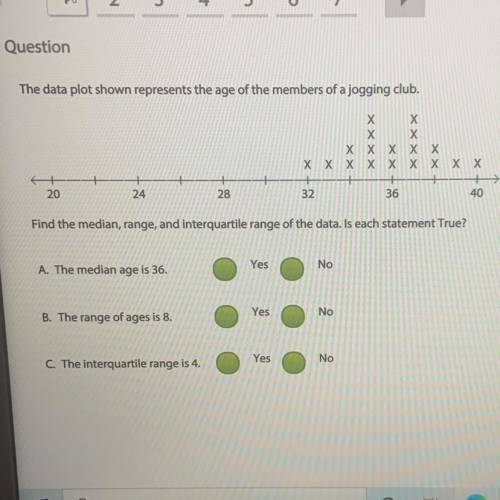
Question
The data plot shown represents the age of the members of a jogging club.
Х Х
Х Х
X X X X Х
X X X X X X X X X
20
24
28
32
36
40
Find the median, range, and interquartile range of the data. Is each statement True?
A. The median age is 36.
Yes
No
B. The range of ages is 8.
Yes
No
C. The interquartile range is 4.
Yes
No

Answers: 3


Other questions on the subject: Mathematics
Mathematics, 21.06.2019 17:40, PONBallfordM89
How can the correlation in the scatter plot graph below best be described? positive correlation negative correlation both positive and negative no correlation
Answers: 1
Mathematics, 21.06.2019 17:50, aaroncx4900
Jace wrote a sentence as an equation. 56 is 14 more than a number. 14+ = 56 which statement best describes jace's work? jace is not correct. the phrase more than suggests using the symbol > and jace did not use that symbol. jace is not correct. he was correct to use addition, but the equation should be 56+ p = 14 jace is not correct. the first number in the sentence is 56, so the equation should start with 56. jace is correct. the phrase more than suggests addition, so jace showed that 14 plus a variable equals 56. o
Answers: 1
Mathematics, 21.06.2019 20:00, gordon57
Someone answer asap for ! max recorded the heights of 500 male humans. he found that the heights were normally distributed around a mean of 177 centimeters. which statements about max’s data must be true? a. the median of max’s data is 250 b. more than half of the data points max recorded were 177 centimeters. c. a data point chosen at random is as likely to be above the mean as it is to be below the mean. d. every height within three standard deviations of the mean is equally likely to be chosen if a data point is selected at random.
Answers: 1
You know the right answer?
Questions in other subjects:


