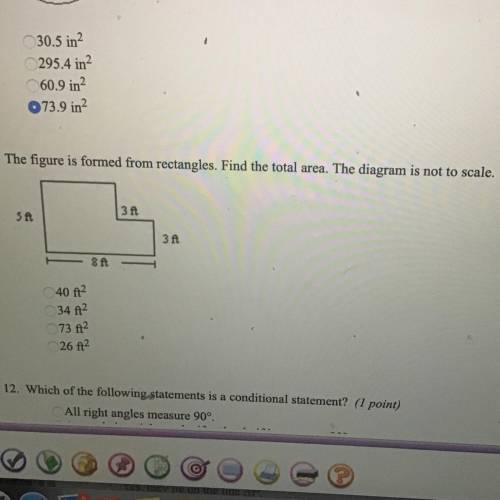
The figure is formed from rectangles. Find the total area. The diagram is not to scale.
40 12
...

Mathematics, 05.01.2021 23:30 phagonphillips4675
The figure is formed from rectangles. Find the total area. The diagram is not to scale.
40 12
34 f1²
73 2
26f2

Answers: 1


Other questions on the subject: Mathematics
Mathematics, 21.06.2019 19:10, brainewashed11123
Which of the following is the shape of a cross section of the figure shown below
Answers: 3
Mathematics, 21.06.2019 21:30, xaguilar
Data from 2005 for various age groups show that for each $100 increase in the median weekly income for whites, the median weekly income of blacks increases by $105. also, for workers of ages 25 to 54 the median weekly income for whites was $676 and for blacks was $527. (a) let w represent the median weekly income for whites and b the median weekly income for blacks, and write the equation of the line that gives b as a linear function of w. b = (b) when the median weekly income for whites is $760, what does the equation in (a) predict for the median weekly income for blacks?
Answers: 2
Mathematics, 21.06.2019 23:00, utjfkdndidndldn62121
Why is it so easy to buy on impulse and overspend with a credit card? what could you do to counteract this tendency?
Answers: 1
You know the right answer?
Questions in other subjects:
Mathematics, 30.04.2021 16:30


Mathematics, 30.04.2021 16:30
Mathematics, 30.04.2021 16:30
Mathematics, 30.04.2021 16:30


