HURY
According to the graph, which of the following is true?
a.
Rural population was in...

Mathematics, 05.01.2021 18:30 dakotakeating4513
HURY
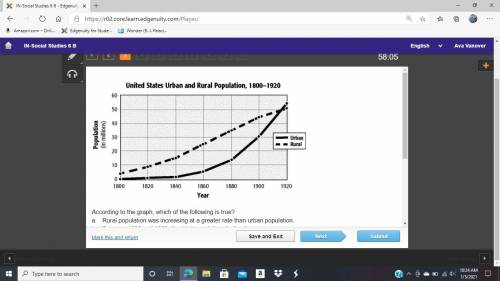
According to the graph, which of the following is true?
a.
Rural population was increasing at a greater rate than urban population.
b.
Between 1900 and 1920, the total population declined.
c.
Between 1900 and 1920, urban population increased at a greater rate than rural population.
d.
Urban population grew more quickly before the Civil War.

Answers: 2


Other questions on the subject: Mathematics
Mathematics, 21.06.2019 16:30, angie07253
Amuffin recipe, which yields 12 muffins, calls for cup of milk for every 1 cups of flour. the same recipe calls for cup of coconut for every cup of chopped apple. to yield a batch of 30 muffins, how much flour will be needed in the mix?
Answers: 1
You know the right answer?
Questions in other subjects:

Biology, 01.09.2020 20:01

Social Studies, 01.09.2020 20:01
Mathematics, 01.09.2020 20:01

Physics, 01.09.2020 20:01


English, 01.09.2020 20:01
Mathematics, 01.09.2020 20:01


