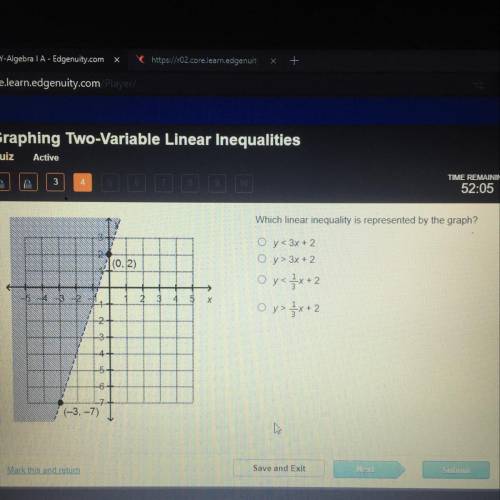
Which linear inequality is represented by the graph?
Oy<3x +2
O y>3x+2
O y
O y>...

Mathematics, 05.01.2021 17:50 bbanfield1
Which linear inequality is represented by the graph?
Oy<3x +2
O y>3x+2
O y
O y>x+2

Answers: 2


Other questions on the subject: Mathematics
Mathematics, 21.06.2019 18:00, dlaskey646
The swimming pool is open when the high temperature is higher than 20∘c. lainey tried to swim on monday and thursday (which was 3 days later). the pool was open on monday, but it was closed on thursday. the high temperature was 30∘c on monday, but decreased at a constant rate in the next 3 days. write an inequality to determine the rate of temperature decrease in degrees celsius per day, d, from monday to thursday.
Answers: 1
You know the right answer?
Questions in other subjects:

Social Studies, 17.05.2021 21:40
Mathematics, 17.05.2021 21:40

English, 17.05.2021 21:40

Health, 17.05.2021 21:40
Mathematics, 17.05.2021 21:40

Mathematics, 17.05.2021 21:40
English, 17.05.2021 21:40
English, 17.05.2021 21:40


