
Mathematics, 05.01.2021 08:30 shelbycg02
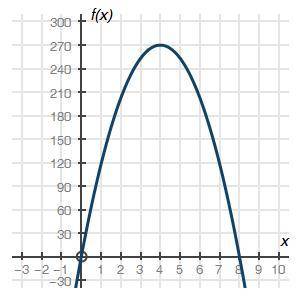
The graph below shows a company's profit f(x), in dollars, depending on the price of erasers x, in dollars, being sold by the company:
Part A: What do the x-intercepts and maximum value of the graph represent? What are the intervals where the function is increasing and decreasing, and what do they represent about the sale and profit? (6 points)
Part B: What is an approximate average rate of change of the graph from x = 1 to x = 4, and what does this rate represent? (4 points)
(10 points Total)

Answers: 1


Other questions on the subject: Mathematics
Mathematics, 21.06.2019 13:30, calebnlocke
What is the vertical asymptotes of the function f(x)=x-2/x*2-3x-4
Answers: 1
Mathematics, 21.06.2019 19:30, AriesTwice
Acollection of coins has value of 64 cents. there are two more nickels than dimes and three times as many pennies as dimes in this collection. how many of each kind of coin are in the collection?
Answers: 1
Mathematics, 21.06.2019 21:30, jamarengle2
Write 5(6x+4)-2(5x-2) in the form a(bx+c) where a, b and c integers and a> 1
Answers: 1
Mathematics, 21.06.2019 23:00, bravooyessenia
Mr. rose asked his students to draw a quadrilateral with 4 unequal sides. draw an example of this kind of quadrilateral.
Answers: 2
You know the right answer?
The graph below shows a company's profit f(x), in dollars, depending on the price of erasers x, in d...
Questions in other subjects:


Mathematics, 24.10.2021 02:00


Geography, 24.10.2021 02:00


