
Mathematics, 05.01.2021 01:00 jamayeah02
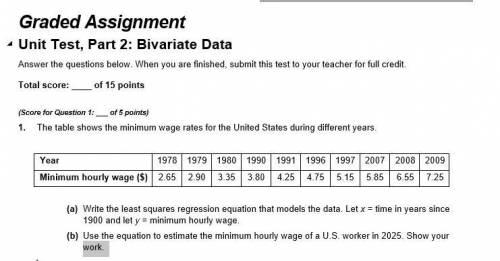
1. The table shows the minimum wage rates for the United States during different years.
Year 1978 1979 1980 1990 1991 1996 1997 2007 2008 2009
Minimum hourly wage ($) 2.65 2.90 3.35 3.80 4.25 4.75 5.15 5.85 6.55 7.25
(a) Write the least squares regression equation that models the data. Let x = time in years since 1900 and let y = minimum hourly wage.
(b) Use the equation to estimate the minimum hourly wage of a U. S. worker in 2025. Show your work.

Answers: 1


Other questions on the subject: Mathematics
Mathematics, 21.06.2019 17:00, bhebert6057
Cameron indoor stadium at duke university is one of the most revered sites in all of college basketball, as well as in all of sports period. duke’s men’s and women’s basketball programs have attained quite a few wins in the building over the last seventy years. cameron indoor stadium is capable of seating 9,460 people. for each game, the amount of money that the duke blue devils’ athletic program brings in as revenue is a function of the number of people in attendance. if each ticket costs $45.50, find the domain and range of this function.
Answers: 1
Mathematics, 21.06.2019 17:40, JordanJones04402
Given f(x)= 9x+1 and g(x)=x^3, choose the expression (f*g)(x)
Answers: 2
Mathematics, 21.06.2019 21:00, cicimarie2018
Choose the equation that represents the graph below: (1 point) graph of a line passing through points negative 3 comma 0 and 0 comma 3 y = x − 3 y = −x + 3 y = −x − 3 y = x + 3 will award !
Answers: 3
You know the right answer?
1. The table shows the minimum wage rates for the United States during different years.
Year 1978 1...
Questions in other subjects:

History, 22.04.2020 22:05
Mathematics, 22.04.2020 22:06

Social Studies, 22.04.2020 22:06

English, 22.04.2020 22:06
History, 22.04.2020 22:06


