
Mathematics, 04.01.2021 20:00 izzyisawesome5232
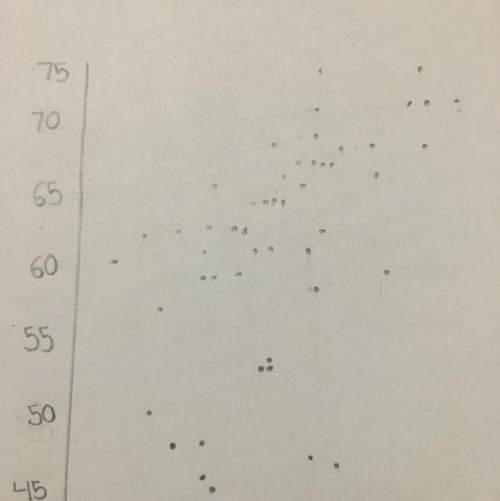
The scatter plot shows the number of strawberries that have been picked on the farm during the month of February: A scatter plot with points showing an upward trend with points that are moderately spread out from a line of best fit. The y axis is labeled Number of Strawberries and the x axis is labeled Days in February Part A: Using computer software, a correlation coefficient of r = 0.01 was calculated. Based on the scatter plot, is that an accurate value for this data? Why or why not? (5 points) Part B: Instead of comparing the number of strawberries picked and the day in February, write a scenario that would be a causal relationship for strawberries picked on the farm. (5 points)

Answers: 3


Other questions on the subject: Mathematics
Mathematics, 21.06.2019 17:00, carkin9076
Parks is wearing several rubber bracelets one third of the bracelets are tie-dye 1/6 are blue and 1/3 of the remainder are camouflage if parks wears 2 camouflage bracelets how many bracelets does he have on
Answers: 2
Mathematics, 21.06.2019 18:00, ddavid9361
Li buys supplies so he can make and sell key chains. he begins to make a profit only after he sells 4 key chains. what point on the graph makes the most sense in this situation?
Answers: 2
Mathematics, 21.06.2019 22:50, alisonlebron15
What is the ordered pair of m’ after point m (5, 6) is rotated 90° counterclockwise?
Answers: 2
You know the right answer?
The scatter plot shows the number of strawberries that have been picked on the farm during the month...
Questions in other subjects:

Computers and Technology, 17.02.2020 19:39

Mathematics, 17.02.2020 19:39

Computers and Technology, 17.02.2020 19:39


