
Mathematics, 04.01.2021 06:30 hargunk329
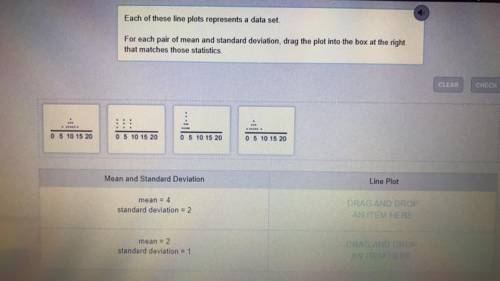
Each of these line plots represents a data set
For each pair of mean and standard deviation, drag the plot into the box at the right
that matches those statistics

Answers: 1


Other questions on the subject: Mathematics
Mathematics, 21.06.2019 19:00, JvGaming2001
The probability that you roll a two on a six-sided die is 1 6 16 . if you roll the die 60 times, how many twos can you expect to roll
Answers: 1
Mathematics, 21.06.2019 21:40, oprajapati
The management of a supermarket wants to adopt a new promotional policy of giving a free gift to every customer who spends more than a certain amount per visit at this supermarket. the expectation of the management is that after this promotional policy is advertised, the expenditures for all customers at this supermarket will be normally distributed with a mean of $95 and a standard deviation of $20. if the management wants to give free gifts to at most 10% of the customers, what should the amount be above which a customer would receive a free gift?
Answers: 2
You know the right answer?
Each of these line plots represents a data set
For each pair of mean and standard deviation, drag t...
Questions in other subjects:


