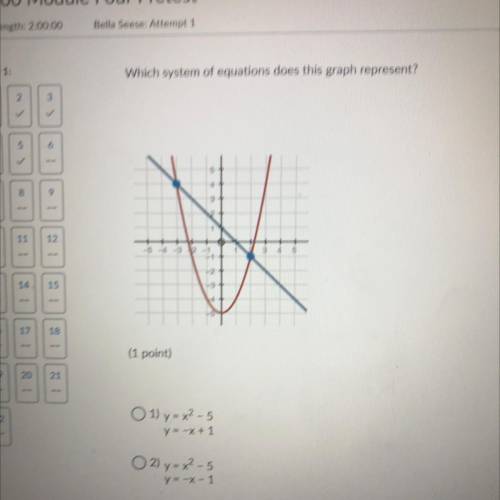
Which system of equations does this graph represent?
(1 point)
1) y = x2 - 5
y = -x + 1...

Mathematics, 04.01.2021 01:00 smartgirl143
Which system of equations does this graph represent?
(1 point)
1) y = x2 - 5
y = -x + 1
2) y = x2 - 5
y = -x - 1
O3) y = x2 + 5
y = -x + 1
4) y = x2 + 5
y = -x-1

Answers: 2


Other questions on the subject: Mathematics
Mathematics, 21.06.2019 17:40, alisucaalisuca
The weight of full–grown tomatoes at a farm is modeled by a normal distribution with a standard deviation of 18.4 grams. the 95 percent confidence interval for the mean weight of the tomatoes is calculated using a sample of 100 tomatoes. what is the margin of error (half the width of the confidence interval)?
Answers: 2
Mathematics, 21.06.2019 19:30, kelseybell2707
If the ratio of sum of the first m and n terms of an ap is m2 : n2 , show that the ratio of its mth and nth terms is (2m − 1) : (2n − 1).
Answers: 1
Mathematics, 21.06.2019 19:50, claytonp7695
Polygon abcde is reflected to produce polygon a′b′c′d′e′. what is the equation for the line of reflection?
Answers: 1
You know the right answer?
Questions in other subjects:


