The data below shows the scores of some students on a test:
21, 27, 29, 20, 22, 33, 23
Which...

Mathematics, 01.01.2021 22:50 mikeeway33
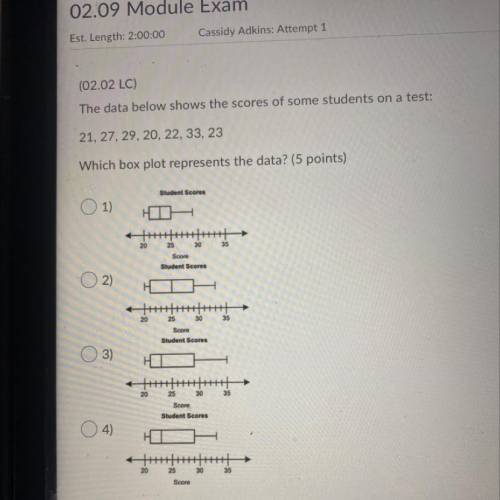
The data below shows the scores of some students on a test:
21, 27, 29, 20, 22, 33, 23
Which box plot represents the data? (5 points)
(The picture should show the box plots)

Answers: 3


Other questions on the subject: Mathematics
Mathematics, 21.06.2019 22:30, BigGirlsTheBest
At the beginning of year 1, carlos invests $600 at an annual compound interest rate of 4%. he makes no deposits to or withdrawals from the account. which explicit formula can be used to find the account's balance at the beginning of year 5? what is, the balance?
Answers: 1
Mathematics, 22.06.2019 01:30, lexyjasmin6781
Write the equation of the circle centered at (10,-2) with radius 2
Answers: 2
Mathematics, 22.06.2019 02:10, shahedalahmad2017
Paula makes stained-glass windows and sells them to boutique stores. if her costs total $12,000 per year plus $4 per window for the frame. how many windows must she produce to earn a profit of at least $48,000 in one year if she sells the windows for $28 each? 1. define a variable for the situation. 2. write an inequality that represents her profit. note: revenue is money coming in. cost is money going out. profit is the difference between the revenue and the cost. in other words: revenue - costs profit 3.using words, describe how many windows she must sell to have a profit of at least $48,000.
Answers: 2
Mathematics, 22.06.2019 04:30, duhitsmiracle59
For the function f(x)=1/x-2 +5 notice that a=1, h=2, k=5 what are the vertical and horizontal asymoptote
Answers: 1
You know the right answer?
Questions in other subjects:

Mathematics, 15.12.2019 07:31


English, 15.12.2019 07:31
History, 15.12.2019 07:31


