
Mathematics, 01.01.2021 22:30 mateotrevino1
I REALLY NEED HELP!!
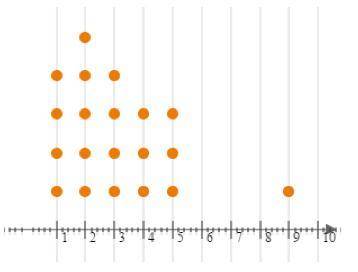
The data for numbers of times per week 20 students at Stackamole High eat vegetables are shown below:
Part A: Describe the dot plot.
Part B: What, if any, are the outliers in these data? Show your work.
Part C: What is the best measure of center for these data? Explain your reasoning.

Answers: 1


Other questions on the subject: Mathematics
Mathematics, 21.06.2019 14:00, AnaiyaKirksey8
Find the area of a trapezoid with bases 14 cm and 18 cm and height 10 cm. 160 cm2 140 cm2 180 cm2 126 cm2
Answers: 3
Mathematics, 21.06.2019 21:30, oliup567
(c) the diagram shows the first three shapes of a matchsticks arrangement. first shape = 3second shape = 5third shape = 7given m represents the number of matchstick used to arrange the n'th shape.(i) write a formula to represent the relation between m and n. express m as the subjectof the formula.(ii) 19 matchsticks are used to make the p'th shape. find the value of p.
Answers: 2
You know the right answer?
I REALLY NEED HELP!!
The data for numbers of times per week 20 students at Stackamole High eat vege...
Questions in other subjects:


Social Studies, 21.01.2021 18:40

English, 21.01.2021 18:40
Mathematics, 21.01.2021 18:40
Mathematics, 21.01.2021 18:40
Biology, 21.01.2021 18:40


