
Mathematics, 31.12.2020 15:20 school4life110
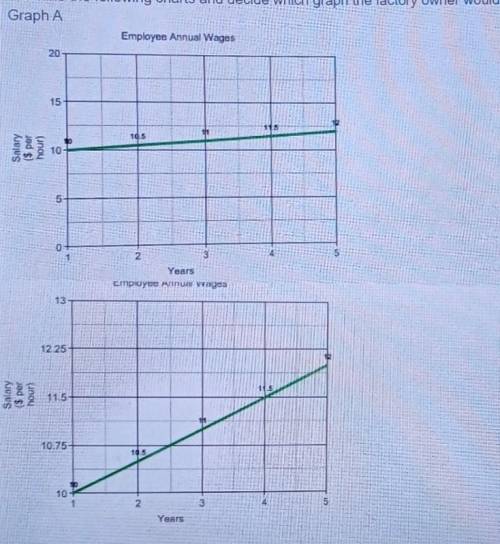
Employee annual wages at a plant rose steadily, but very gradually, from one year to the next during one 5-year period. The factory owner wants to show that worker's wages are rising rapidly. Examine the following charts and decide which graph the factory owner would want to use and why.
Graph A Employee Annual Wages 20 15 10.5 Salary ($ per hour) 10 0 3 Years
Graph B Emplover Annual Wades

Answers: 3


Other questions on the subject: Mathematics
Mathematics, 21.06.2019 17:30, fonsworth5
Kathy spent 5/8 of her money on books and another 1/6 of her money on stationeries. what fraction of kathy’s money was left?
Answers: 2
Mathematics, 21.06.2019 22:00, costel8532
Which of the following graphs could represent a cubic function?
Answers: 1
Mathematics, 21.06.2019 23:00, cifjdhhfdu
If a company produces x units of an item at a cost of $35 apiece the function c=35x is a of the total production costs
Answers: 2
You know the right answer?
Employee annual wages at a plant rose steadily, but very gradually, from one year to the next during...
Questions in other subjects:
Mathematics, 02.02.2021 18:00
Mathematics, 02.02.2021 18:00
Mathematics, 02.02.2021 18:00

Mathematics, 02.02.2021 18:00

Mathematics, 02.02.2021 18:00


