
Mathematics, 28.12.2020 22:50 annie2u559
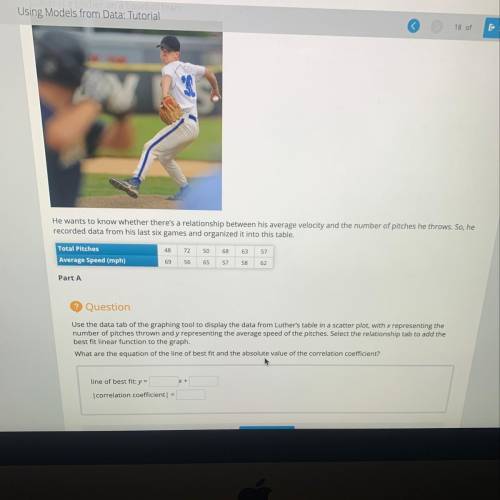
He wants to know whether there's a relationship between his average velocity and the number of pitches he throws. So, he
recorded data from his last six games and organized it into this table.
Total Pitches
48
72
50
68
63
57
Average Speed (mph)
69
56
65
57
58
62
Part A
Question
Use the data tab of the graphing tool to display the data from Luther's table ina scatter plot, with x representing the
number of pitches thrown and y representing the average speed of the pitches. Select the relationship tab to add the
best fit linear function to the graph.
What are the equation of the line of best fit and the absolute value of the correlation coefficient?
line of best fit: y =|
x+
|correlation coefficient| =

Answers: 3


Other questions on the subject: Mathematics
Mathematics, 21.06.2019 18:00, imanim3851
Give all possible names for the line shown. calculation tip: lines can be written with either point first.
Answers: 1
Mathematics, 21.06.2019 20:10, dashawn3rd55
Over which interval is the graph of f(x) = x2 + 5x + 6 increasing?
Answers: 1
You know the right answer?
He wants to know whether there's a relationship between his average velocity and the number of pitch...
Questions in other subjects:
Mathematics, 12.03.2021 06:50

Mathematics, 12.03.2021 06:50
Mathematics, 12.03.2021 06:50


Health, 12.03.2021 06:50
Health, 12.03.2021 06:50
Mathematics, 12.03.2021 06:50

Physics, 12.03.2021 06:50


