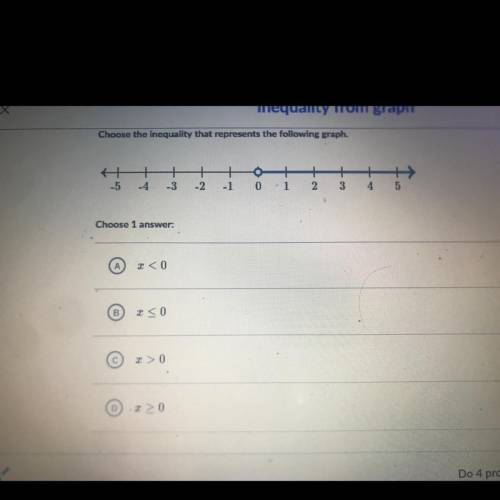
Choose the inequality that represents the following graph.
...

Mathematics, 22.12.2020 17:30 mralxrdk12
Choose the inequality that represents the following graph.

Answers: 1


Other questions on the subject: Mathematics
Mathematics, 21.06.2019 13:00, zaylelangaigne2006
Giving 100 points asap bev has to cut her grandma's grass this weekend and wants to know exactly how much area she will be cutting. calculate the area of the polygon. be sure to show all your work and explain your answer.
Answers: 1
Mathematics, 21.06.2019 18:00, nativebabydoll35
Two students were asked if they liked to read. is this a good example of a statistical question? why or why not? a yes, this is a good statistical question because a variety of answers are given. b yes, this is a good statistical question because there are not a variety of answers that could be given. c no, this is not a good statistical question because there are not a variety of answers that could be given. no, this is not a good statistical question because there are a variety of answers that could be given
Answers: 1
Mathematics, 21.06.2019 21:00, 22MadisonT
Abakery recorded the number of muffins and bagels it sold for a seven day period. for the data presented, what does the value of 51 summarize? a) mean of bagels b) mean of muffins c) range of bagels d) range of muffins sample # 1 2 3 4 5 6 7 muffins 61 20 32 58 62 61 56 bagels 34 45 43 42 46 72 75
Answers: 2
Mathematics, 21.06.2019 23:20, savannahvargas512
For which pairs of functions is (f•g)(x)=12x? f(x)=3-4x and g(x)=16x-3 f(x)=6x2 and g(x)= 2/x f(x)= and g(x) = 144x f(x)=4x and g(x) =3x
Answers: 1
You know the right answer?
Questions in other subjects:


