Scenario: Boa Constrictor Population
Instructions:
View the video found on page 1 of th...

Mathematics, 22.12.2020 03:00 cgarnett5408
Scenario: Boa Constrictor Population
Instructions:
View the video found on page 1 of this journal activity.
Using the information provided in the video, answer the questions below.
Show your work for all calculations.
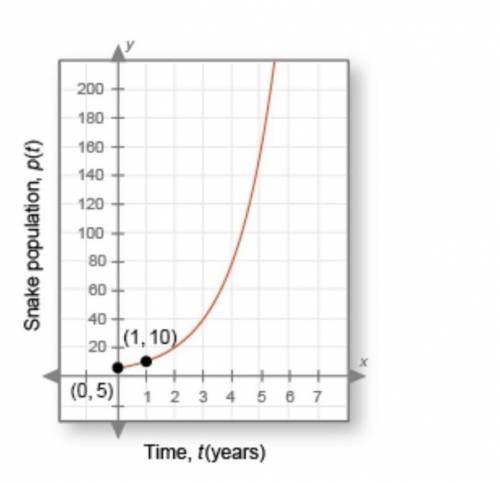
Below is the graph of the boa constrictor population you learned about in the video. The x-axis is t, the time in years, and the y-axis is p(t), the snake population for any given year. In this case, t = 0 indicates the year they started keeping track of the constrictor population. Scientists want to know how the population is changing every two years so they can make predictions about the future.
Analyzing the Data:
1. Is this graph increasing or decreasing? Does this imply that the boa constrictor population is growing or diminishing? (1 point)
2. Looking at this graph, would you agree that the boa constrictor population could become a problem? (1 point)
3. What is the horizontal asymptote of this graph? (1 point)
4. What is the domain? Explain. (1 point)
5. What is the range? Explain. (1 point)
6. What is the y-intercept? What does this mean in terms of the snake population? (1 point)
7. What is the point on the graph when x = 1? What does this mean in terms of the snake population? (1 point)
8. The graph is of a function in the form p(t) = a • bt. What is the function? (2 points)
9. Use this function to estimate the boa constrictor population in 2 years, 3 years, and 4 years.
t: Time in yearsP(t): Estimated snake population at time t
2
3
4
10. What pattern do you see in years 2, 3, and 4? How is the snake population changing every year? (2 points)
11. How is the snake population changing every two years? (1 point)
Making a Decision:
12. Do you think the snake population can continue to grow in this way forever? Why or why not? (2 points)

Answers: 2


Other questions on the subject: Mathematics
Mathematics, 21.06.2019 15:40, rhiannonwheatcr4468
36 inches/second = yards/minute how many yards?
Answers: 1
Mathematics, 21.06.2019 22:30, mackenziepaige6525
The median for the given set of six ordered data values is 29.5 9 12 25 __ 41 48 what is the missing value?
Answers: 1
Mathematics, 21.06.2019 22:30, tdyson3p6xvtu
60 musicians applied for a job at a music school. 14 of the musicians play both guitar and drums, 28 play drums, 18 play the guitar. what is the probability that the applicant who gets the job plays drums or guitar?
Answers: 1
You know the right answer?
Questions in other subjects:

History, 03.11.2021 18:40
Mathematics, 03.11.2021 18:40

Computers and Technology, 03.11.2021 18:50

World Languages, 03.11.2021 18:50

Spanish, 03.11.2021 18:50


