
Mathematics, 21.12.2020 21:50 smartcookie85581
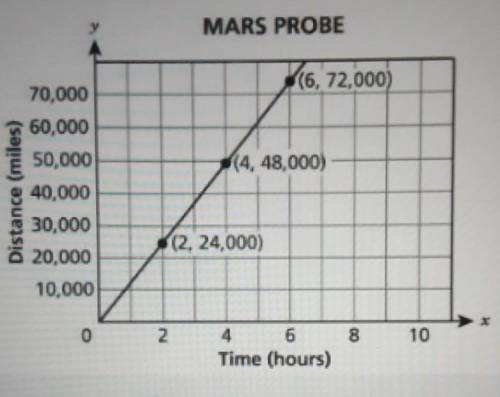
The graph shows the relationship between x, the amount of time in hours, and y, the distance traveled in miles, by a probe before it reaches Mars.

Answers: 2


Other questions on the subject: Mathematics
Mathematics, 20.06.2019 18:04, Tori122367
Use the distributive property to factor the expression. 15x + 6 a) 2 5 b) − 2 5 c) 3(5x + 2) d) 5(3x + 6)
Answers: 1
Mathematics, 21.06.2019 13:50, halbrookc7082
James wants to promote his band on the internet. site a offers website hosting for $4.95 per month with a $49.95 startup fee. site b offers website hosting for $9.95 per month with no startup fee. for how many months would james need to keep the website for site a to be a better choice than site b? 1. define a variable for the situation. 2. write an inequality that represents the situation. 3.solve the inequality to find out how many months he needs to keep the website for site a to be less expensive than site b. 4. using words, describe how many months he needs to keep the website for site a to be less expensive than site b.
Answers: 3
Mathematics, 21.06.2019 21:00, maddyleighanne
Suppose that in 2008 , 840,800 citizens died of a certain disease assuming the population of teh country is 399 miliion, what is the mortality rate in units of deaths per 100,000 people?
Answers: 1
You know the right answer?
The graph shows the relationship between x, the amount of time in hours, and y, the distance travele...
Questions in other subjects:


Business, 10.04.2020 21:56


