
Mathematics, 21.12.2020 17:30 gloriuos355
The business college computing center wants to determine the proportion of business students who have personal computers (PCʹs) at home. If the proportion exceeds 25%, then the lab will scale back a proposed enlargement of its facilities. Suppose 200 business students were randomly sampled and 65 have PCʹs at home. Find the rejection region for this test using α = 0.01. (Note that this is a right-tailed test).
A) Reject H0 if 0 z > 2.33.
B) Reject H0 if 0 z < -2.33.
C) Reject H0 if 0 z > 2.575 or z < -2.575.
D) Reject H0 if 0 z = 2.
Find the test statistic, 0 t , to test the claim about the population mean μ < 6.7 given n = 20, x = 6.3, s = 2.0.
A) -1.233
B) -0.872
C) -1.265
D) -0.894
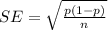
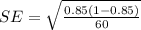
Determine the test statistic, 0 z , to test the claim about the population proportion p < 0.85 given n = 60 and x = 39.
A) -4.34
B) -1.96
C) -1.85
D) -1.76

Answers: 2


Other questions on the subject: Mathematics
Mathematics, 21.06.2019 17:50, aaroncx4900
Jace wrote a sentence as an equation. 56 is 14 more than a number. 14+ = 56 which statement best describes jace's work? jace is not correct. the phrase more than suggests using the symbol > and jace did not use that symbol. jace is not correct. he was correct to use addition, but the equation should be 56+ p = 14 jace is not correct. the first number in the sentence is 56, so the equation should start with 56. jace is correct. the phrase more than suggests addition, so jace showed that 14 plus a variable equals 56. o
Answers: 1
Mathematics, 21.06.2019 20:30, ariannanykole1
What is the best approximation for the area of a circle with a radius of 4 m ? use 3.14 to approximate pi
Answers: 1
Mathematics, 22.06.2019 01:00, s27511583
The weight of 46 new patients of a clinic from the year 2018 are recorded and listed below. construct a frequency distribution, using 7 classes. then, draw a histogram, a frequency polygon, and an ogive for the data, using the relative information from the frequency table for each of the graphs. describe the shape of the histogram. data set: 130 192 145 97 100 122 210 132 107 95 210 128 193 208 118 196 130 178 187 240 90 126 98 194 115 212 110 225 187 133 220 218 110 104 201 120 183 124 261 270 108 160 203 210 191 180 1) complete the frequency distribution table below (add as many rows as needed): - class limits - class boundaries - midpoint - frequency - cumulative frequency 2) histogram 3) frequency polygon 4) ogive
Answers: 1
You know the right answer?
The business college computing center wants to determine the proportion of business students who hav...
Questions in other subjects:


Biology, 12.02.2020 00:36


