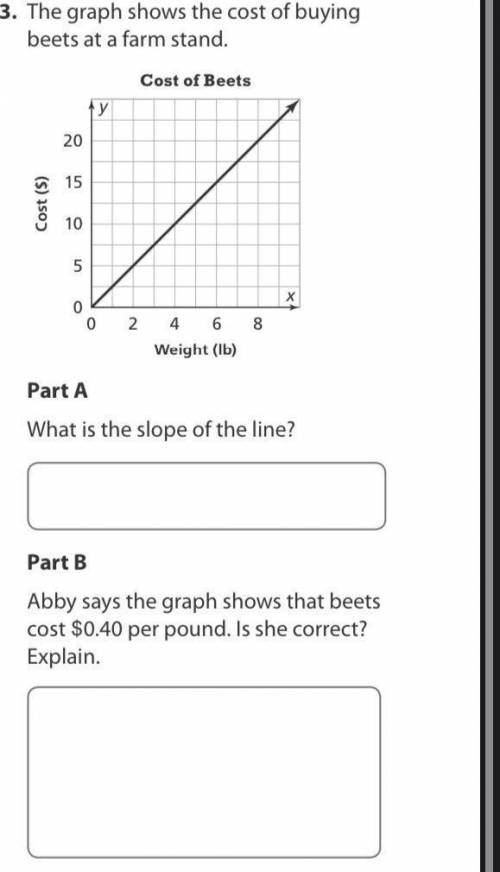
The graph shows the cost of buying beets at a farm stand.. (question continued on image)
...

Mathematics, 21.12.2020 07:00 gracianoa
The graph shows the cost of buying beets at a farm stand.. (question continued on image)

Answers: 3


Other questions on the subject: Mathematics
Mathematics, 21.06.2019 15:40, 1tallison1
What is the first quartile of this data set? 10, 11, 12, 15, 17, 19, 22, 24, 29, 33, 38 a. 12 b. 19 c. 29 d. 10
Answers: 1
Mathematics, 21.06.2019 20:30, yeetmaster7688
Find the value of x for which line a is parallel to line b
Answers: 1
Mathematics, 21.06.2019 20:50, autumnxng3094
A. what is the area of the base? use complete sentences to explain your reasoning. b. what is the volume of the prism? use complete sentences to explain your reasoning.
Answers: 1
You know the right answer?
Questions in other subjects:

Geography, 08.01.2020 02:31

Chemistry, 08.01.2020 02:31
Mathematics, 08.01.2020 02:31

Advanced Placement (AP), 08.01.2020 02:31

Biology, 08.01.2020 02:31

History, 08.01.2020 02:31
Mathematics, 08.01.2020 02:31

Health, 08.01.2020 02:31


