QuestIOM SO
If the following data were transformed, and points with the coordinates
(xlog(y))...

Mathematics, 20.12.2020 05:00 eddiecas
QuestIOM SO
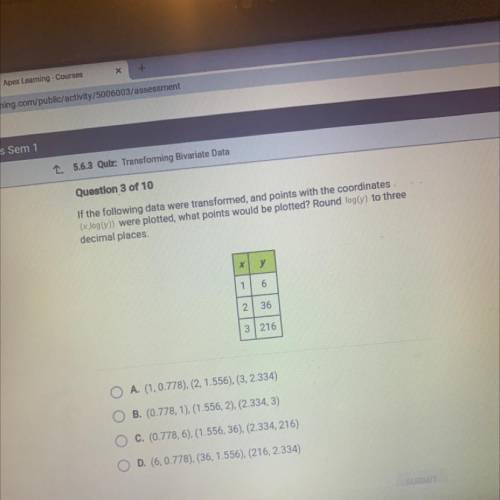
If the following data were transformed, and points with the coordinates
(xlog(y)) were plotted, what points would be plotted? Round log(y) to three
decimal places.
6
2
36
3|216|
O A. (1, 0.778), (2, 1.556), (3, 2.334)
O B. (0.778, 1), (1.556, 2), (2.334, 3)
O C. (0.778, 6), (1.556, 36), (2.334, 216)
OD. (6, 0.778), (36, 1.556), (216, 2.334)

Answers: 2


Other questions on the subject: Mathematics
Mathematics, 21.06.2019 18:00, alyssatamayo641
What is the solution of log2 (3x - 7) = 3? 4 5
Answers: 1
Mathematics, 21.06.2019 23:10, ineedhelp2285
The input to the function is x and the output is y. write the function such that x can be a vector (use element-by-element operations). a) use the function to calculate y(-1.5) and y(5). b) use the function to make a plot of the function y(x) for -2 ≤ x ≤ 6.
Answers: 1
You know the right answer?
Questions in other subjects:

Mathematics, 03.12.2020 20:50

History, 03.12.2020 20:50
Mathematics, 03.12.2020 20:50
Mathematics, 03.12.2020 20:50
Mathematics, 03.12.2020 20:50


Social Studies, 03.12.2020 20:50


