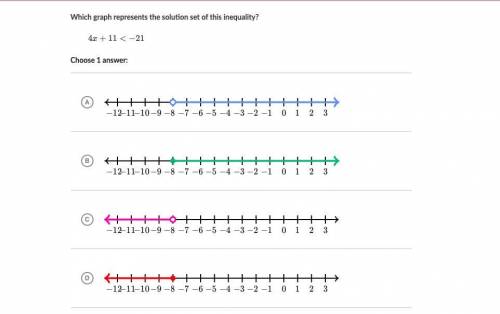
Which graph represents the solution set of this inequality?
4x + 11 < −21
Choose 1 <...

Mathematics, 18.12.2020 19:30 Stuckonhomework
Which graph represents the solution set of this inequality?
4x + 11 < −21
Choose 1
Please help me!! Thanks!

Answers: 1


Other questions on the subject: Mathematics
Mathematics, 21.06.2019 15:50, tmarie03
Which formula finds the probability that a point on the grid below will be in the blue area? p(blue) = total number of squares number of blue squares number of blue squares p(blue) = total number of squares number of blue squares p(blue) = number of white squares
Answers: 1
Mathematics, 21.06.2019 19:30, tigistamare03
Acabinmaker buys 3.5 liters of oat varnish the varnish cost $4.95 per liter what is the total cost of 3.5 liters
Answers: 1
Mathematics, 21.06.2019 19:30, BaileyElizabethRay
Which graph represents the equation y =4x
Answers: 1
You know the right answer?
Questions in other subjects:

Mathematics, 01.07.2019 03:30
Mathematics, 01.07.2019 03:30

Physics, 01.07.2019 03:30

Geography, 01.07.2019 03:30
Mathematics, 01.07.2019 03:30


History, 01.07.2019 03:30


