
Mathematics, 18.12.2020 14:00 dpranavesh446
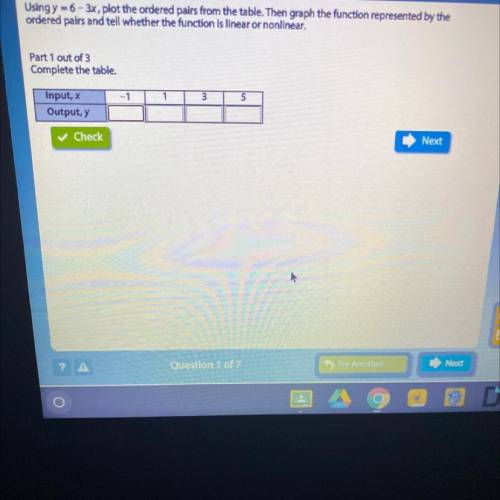
Using y=6-3x plot the ordered pairs from the table then graph the function represented by the ordered pairs and tell whether the function is linear or nonlinear PLS ANSWER FAST ITS DUE IN 10 mins

Answers: 2


Other questions on the subject: Mathematics
Mathematics, 20.06.2019 18:02, jonathan3191
How do you find the equation of line of best fit? urgent
Answers: 2
Mathematics, 21.06.2019 16:00, jeff7259
The scatter plot graph shows the average annual income for a certain profession based on the number of years of experience which of the following is most likely to be the equation of the trend line for this set of data? a. i=5350e +37100 b. i=5350e-37100 c. i=5350e d. e=5350e+37100
Answers: 1
Mathematics, 21.06.2019 16:30, RealGibbon857
The temperature of chicken soup is 192.7°f. as it cools, the temperature of the soup decreases 2.3°f per minute. what is the temperature in degrees fahrenheit of the soup after 25 minutes? a. 27.3°f b. 57.5°f c. 135.2°f d. 250.2°f
Answers: 1
Mathematics, 21.06.2019 18:00, mihirkantighosh
Arecipe calls for 32 fluid ounces of heavy cream. how many 1 pint containers of heavy cream are needed to make the recipe?
Answers: 2
You know the right answer?
Using y=6-3x plot the ordered pairs from the table then graph the function represented by the ordere...
Questions in other subjects:
Mathematics, 19.12.2020 05:30
Mathematics, 19.12.2020 05:30

Chemistry, 19.12.2020 05:30
Mathematics, 19.12.2020 05:30
Mathematics, 19.12.2020 05:30

Biology, 19.12.2020 05:30
Mathematics, 19.12.2020 05:30

History, 19.12.2020 05:30
Mathematics, 19.12.2020 05:30
Mathematics, 19.12.2020 05:30


