Mathematics, 18.12.2020 01:10 mmelody5
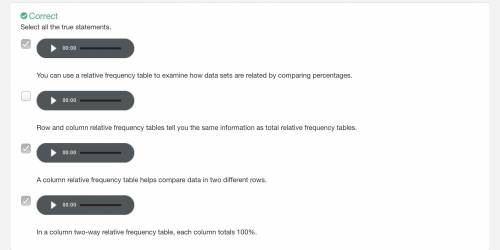
Select all the true statements.
You can use a relative frequency table to examine how data sets are related by comparing percentages.
Row and column relative frequency tables tell you the same information as total relative frequency tables.
A column relative frequency table helps compare data in two different rows.
In a column two-way relative frequency table, each column totals 100%.

Answers: 2


Other questions on the subject: Mathematics

Mathematics, 21.06.2019 17:10, shayneseaton
Find the value of x for which the lines are parallel.
Answers: 1

Mathematics, 21.06.2019 19:00, autumn8668
Stefano accidentally dropped his sunglasses off the edge of a canyon as he was looking down. the height, h(t), in meters (as it relates to sea level), of the sunglasses after t seconds, is shown in the table. during its descent, the pair of sunglasses passed by a climber in the canyon 6 seconds after stefano dropped them. to the nearest meter, what is difference in elevation between stefano and the climber? 166 meters 176 meters 230 meters 240 meters its b.176 i took the test 166 is wrong and 176 is correct
Answers: 1


Mathematics, 21.06.2019 20:00, beverlyamya
Three baby penguins and their father were sitting on an iceberg 0.50.50, point, 5 meters above the surface of the water. the father dove down 4.74.74, point, 7 meters from the iceberg into the water to catch dinner for his kids. what is the father penguin's position relative to the surface of the water?
Answers: 2
You know the right answer?
Select all the true statements.
You can use a relative frequency table to examine how data sets are...
Questions in other subjects:

Mathematics, 01.03.2021 21:50

English, 01.03.2021 21:50


Mathematics, 01.03.2021 21:50


Biology, 01.03.2021 21:50

Business, 01.03.2021 21:50


