
Mathematics, 18.12.2020 01:00 astra
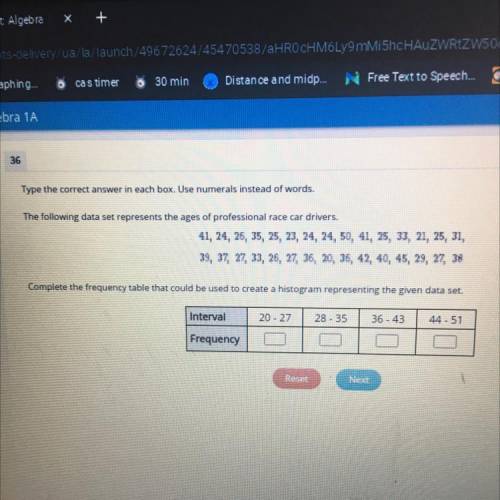
The following data set represents the ages of professional race car drivers.
41, 24, 26, 35, 25, 23, 24, 24, 50, 41, 25, 33, 21, 25, 31,
39, 37, 27, 33, 26, 27, 36, 20, 36, 42, 40, 45, 29, 27, 38
Complete the frequency table that could be used to create a histogram representing the given data set.
Interval
20 - 27
28-35
36-43
44-51
Frequency

Answers: 1


Other questions on the subject: Mathematics
Mathematics, 21.06.2019 20:30, corbeansbrain
Someone answer asap for ! michele pushes a box d meters across a floor. she uses a force f, in newtons, to push the box. she pushes the box for t seconds. the formula p = fd/t calculates the power, p, in watts, that it takes for michele to complete the task. solve the formula for d.
Answers: 2
You know the right answer?
The following data set represents the ages of professional race car drivers.
41, 24, 26, 35, 25, 23...
Questions in other subjects:


History, 07.10.2020 14:01

English, 07.10.2020 14:01

Medicine, 07.10.2020 14:01
Mathematics, 07.10.2020 14:01
History, 07.10.2020 14:01
Health, 07.10.2020 14:01


