23. The graph of part of linear function g is shown on the grid.
x
Which inequality best repr...

Mathematics, 17.12.2020 20:50 alyo31500
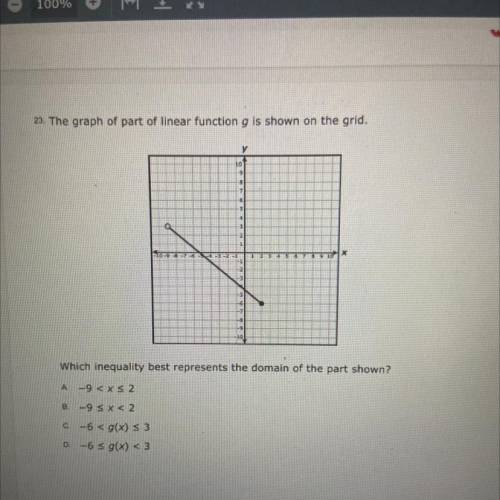
23. The graph of part of linear function g is shown on the grid.
x
Which inequality best represents the domain of the part shown?
A-9 < x S 2
B-95x< 2
c-6 < g(x) = 3
D-6 = g(x) < 3

Answers: 1


Other questions on the subject: Mathematics
Mathematics, 21.06.2019 13:20, Ncale
What should be done to solve the equation? x+14=21 add 14 to both sides of the equation. subtract 14 from the left side of the equation. add 14 to the left side and subtract 14 from the right side of the equation. subtract 14 from both sides of the equation.
Answers: 2
Mathematics, 21.06.2019 22:20, flippinhailey
The mean of 10 values is 19. if further 5 values areincluded the mean becomes 20. what is the meanthese five additional values? a) 10b) 15c) 11d) 22
Answers: 1
You know the right answer?
Questions in other subjects:


English, 15.11.2019 17:31

Geography, 15.11.2019 17:31
Mathematics, 15.11.2019 17:31
Mathematics, 15.11.2019 17:31
Mathematics, 15.11.2019 17:31
Mathematics, 15.11.2019 17:31
English, 15.11.2019 17:31


